Over the past number of weeks we focused rather intently on the argument that the point of maximum stress had been reached at the end of September and that from here the markets would need little more than a solid nudge to confirm the validity of an ongoing recovery. Yesterday, of course, we got a bit more than a nudge- more like a baseball bat to the back of the bear’s heads.
Our somewhat unfortunate tendency is to work ahead of the markets. When asset prices were in free-fall we worked on trying to pick the bottom. The combination of the dollar and TBonds along with the price spread between the 30-year and 10-year Treasury futures worked quite nicely. As the equity markets curled higher we changed gears as we attempted to find one or more indicators that would work to confirm the start of the recovery. The Bank Index and ratio between equities and bonds (SPX/TBonds) proved to be quite helpful with this.
Now… our focus has shifted once again. While it is always possible that some piece of unexpected news will jump out and reverse the recovery we will assume, after yesterday, that it is locked and loaded. With this in mind the next step is to try to define what will happen next. Our first run at the subject is based on the way the markets recovered after 1998’s Asian crisis.
There are a number of key differences between 1998 and 2011 so we are using a fairly broad brush with this one. Keep in mind that period of crisis between the autumn of 1998 and the spring of 1999 marked the lows for crude oil and copper prices along with the commodity currencies. Such is most certainly not the case today.
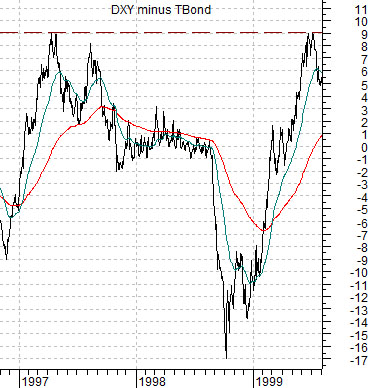
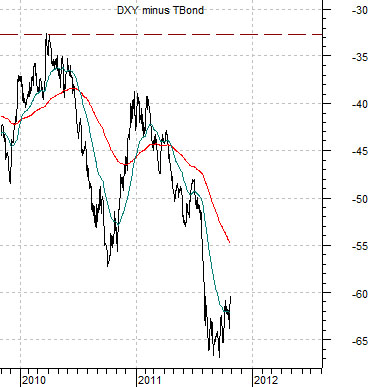
Just below is a chart of the spread between the U.S. Dollar Index (DXY) futures and U.S. 30-year T-Bond futures from late 1996 into 1999. Below right is the same spread from the end of 2009 to the present day.
The build up to the Asian crisis was marked by a falling spread as bond prices rose relative to the dollar. The recovery pulled the spread higher as bond prices declined relative to the dollar. Based on the way the spread declined from the spring of 2010 into the autumn of this year one of the more likely outcomes into 2012 will be a rising spread. The difference between the price of the Dollar Index and the TBond should narrow from the lows of -65 (TBonds 65 points higher than the Dollar) to something less than -35. Our thought is that ultimately this will support the dollar as long-term Treasury prices decline.
Equity/Bond Markets
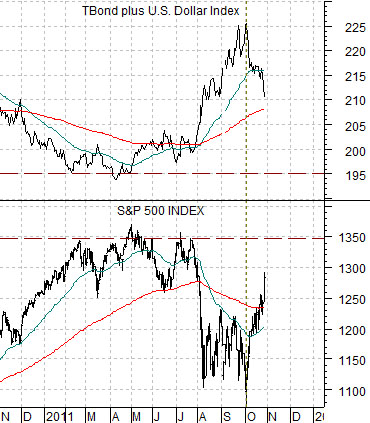
Below is a comparison between the sum of the U.S. 30-year T-Bond futures and U.S. Dollar Index futures and the S&P 500 Index.
The argument is that the offset to weakness in the S&P 500 Index has been some combination of bond market price strength and dollar price strength. If the point of maximum stress was reached at the end of this year’s third quarter then a recovery should include falling bond prices and/or a weaker dollar.
Obviously both the dollar and bond market were lower yesterday which helped to sling shot the equity markets to the upside.
Let’s quickly go back over what bond and dollar price weakness mean in terms of the market’s trend.
A weaker bond market (falling bond prices and rising yields) suggests improving economic strength. This tends to favor the cyclical sectors with a particular emphasis these days on the laggard banks.
A weaker dollar tends to support raw materials prices so as the dollar declines the basic materials and energy sectors tend to outperform. This was evident- in spades- yesterday.
A weak bond market and falling dollar will focus attention on the commodity cyclicals. A weak bond market and flat to stronger dollar will tend to support the consumer cyclicals and financials.
Below is a chart comparison between Wells Fargo (WFC) and the point spread or difference between the 30-year and 10-year Treasury futures.
The 30- 10 spread is one way to view the trend for the bond market. The spread rises as bond prices move higher and tends to spike dramatically during periods of ‘stress’.
We pointed out on many occasions that the absolute peak for the 30-10 spread at the end of 2008 was just above +14. It reached the same level at the end of September this year. This suggested that in terms of the bond market the trend was as bearish and extreme a few weeks back as it was at the worst point following 1998’s subprime asset price melt down.
In any event… that wasn’t our point today.
We argued a few weeks ago that- at minimum- we should start thinking about the potential for a stock market ‘top’ once the 30- 10 spread declines back below ‘0’. In fact the spread can spend some time at or below 0 (a level of 0 means that the price of the 30-year Treasuries is the same or lower than that of the 10-year T-Note futures. Yesterday the 30-years closed at 135 13/32 while the 10-year ended at 127 10/32) and we usually do not see much in the way of bearish pressure until the spread has risen back up above +1 or +2.
The idea is that we are on the road to recovery but are still some distance in terms of both prices and time from reaching levels that will launch us into trying to identify the next top.