Equities are one part growth and one part valuation. The stock market is driven, on the one hand, by changes in interest rates and, on the other hand, by changes in the perception of future growth.
In the good old days the stock market would generally lag the bond market at the turns and trade with bonds through the bulk of the cycle. Rising bond prices would in due course lead to rising stock prices while an excess of cyclical growth would lead to rising interest rates and ultimately lower stock prices.
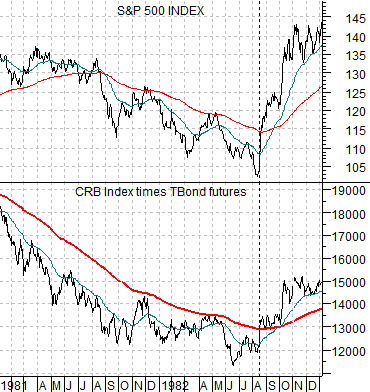
If we distill ‘valuation’ into the trend for the U.S. 30-year T-Bond futures and ‘cyclical growth’ into the trend for commodity prices (CRB Index) then the S&P 500 Index might be expected to trend with the combination of the two. Which, of course, is exactly what happened coming out of the 1981- 82 bear market.
At top right is a comparison between the S&P 500 Index and the combination of the CRB Index multiplied by the U.S. 30-year T-Bond futures.
Bond prices began to recover in late 1981 while the CRB Index did not reach bottom until October of 1982. The S&P 500 Index, however, turned higher in August of 1982. The explanation for this can be seen on the chart. The product of bonds times commodities broke up through the 200-day e.m.a. line at virtually the same point in time as the SPX.
The problem is that some time during the 1990’s the relationship between the bond and stock market reversed. Equity valuations are still impacted positively by rising bond prices but the real driver is cyclical growth. This means that instead of trading with bond PRICES the S&P 500 Index tends to trade with bond YIELDS.
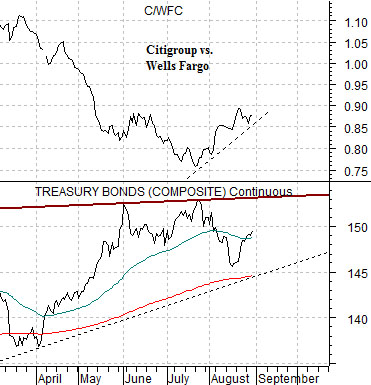
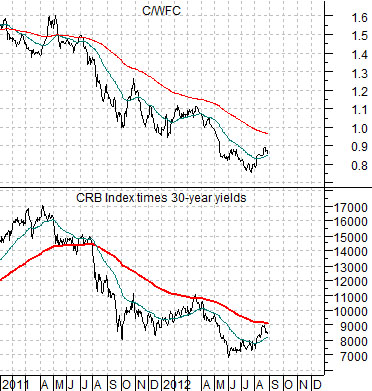
At bottom right is a comparison between the CRB Index time 30-year Treasury yields and… the ratio between Citigroup (C) and Wells Fargo (WFC).
The C/WFC ratio is supposed to represent the cyclical trend. The ratio pits a lagging bank (C) against a leading bank (WFC).
The point? We are watching the combination of the CRB Index times yields because our view is that it should break above its moving average lines around the same time as the C/WFC ratio. It came very close earlier this month…
Equity/Bond Markets
On the first page we attempted to show that the cyclical trend (depicted by the ratio between the lagging banks and the leading banks) should turn higher when the combination of long-term yields and commodity prices rises up through the 200-day e.m.a. line. Let’s take another look at this from a different angle.
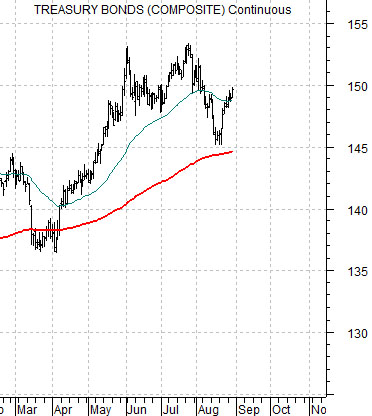
Below is a comparison between the C/WFC ratio and the U.S. 30-year T-Bond futures.
The T-Bond futures have been trending higher within a fairly well defined channel for over 30 years. Our view is that the channel top is situated right above current prices at the highs set in May and July.
The lagging/leading banks ratio (C/WFC) should trade inversely to the TBond futures. It should bottom and turn higher at the peak for the TBonds. The question is… did we see the cycle trend change point last month when the ratio hit a low concurrent with the last bond price peak?
To make this argument ‘work’ we need to make the case that bond prices have already reached a major top. The kind of top that could hold for years, decades, or perhaps even generations.
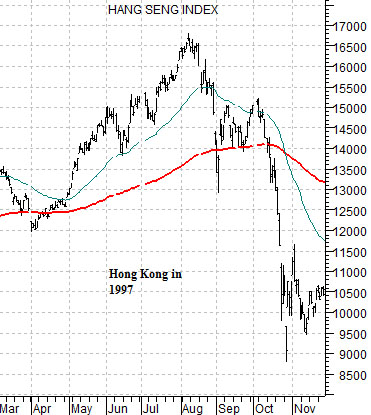
At top right is a chart of Hong Kong’s Hang Seng Index from 1997. The Hang Seng Index is thoroughly ‘cyclical’. The bond market, on the other hand, is the opposite of cyclical, the inverse to cyclical, and the offset to cyclical.
The idea is that the TBond futures declined sharply down towards the 200-day e.m.a. line in a manner somewhat similar to the Hang Seng Index in 1997. We argued a few weeks ago that it was likely that the TBond futures would push ‘up and out’ into September with a more serious trend change due closer to the end of the quarter. To us the TBond futures look a bit like the Hang Seng Index in September of 1997. If the C/WFC ratio continues to rise next month in the face of bond prices that simply don’t seem to want to decline then, at least in theory, we could be setting up for a major water fall decline for long-term bonds.