March 11 (Bloomberg) — Canada’s dollar traded near the strongest level in five months against the greenback as crude oil and stocks gained before a report tomorrow forecast to show the nation’s economy added jobs in February.
Our problem is that we believe that the Canadian dollar is going to resolve back down to around .80. We suppose this is only a problem because the currency keeps rising. Fortunately we have never let a strong trend stand in the way of one of our macro views.
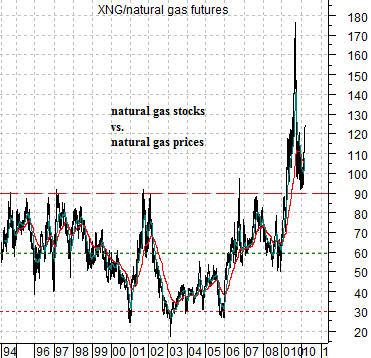
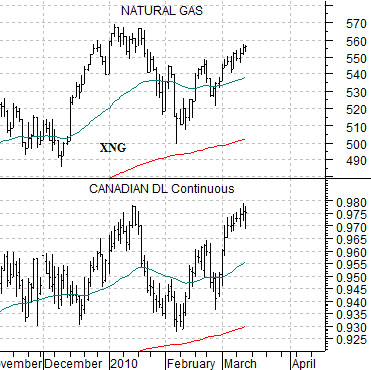
At top right we show a chart of the ratio between the Natural Gas Index (XNG) and natural gas futures.
The argument is that from 1994 through 2009 the ratio always traded at 90:1 or lower with a mid-point close to 60:1. Today the ratio is around 125:1 which is the market’s way of saying that natural gas prices are definitely ‘too low’.
Below right is a comparison between the XNG and the Canadian dollar (CAD) futures. The idea here is that the trends have been almost identical for the past few years.
With the XNG currently close to 555 the market is saying that natural gas prices should be trading no lower than 6 and, in due course, back up to 9. At a price of 6 the ratio would be 92.5:1 while with a price of 9 the ratio would be closer to 60:1.
We have learned that it generally does not pay to argue with the equity markets but, unfortunately, that rarely stops us from doing so. We noticed, for example, that Goldman Sachs reduced its expected price target for natural gas in 2010 from 6.00 to 5.50 yesterday while cutting the 2011 price from 6.50 to 6.00.
The point is that with gas at 6 or lower for the next two years one would expect to see the XNG trade back down from 555 to something closer to 360. The tight relationship between this index and the Canadian dollar suggests that if the XNG were to move back to that level the CAD should be fairly close to .80. It may take a year or two and the loonie may take a run north of parity with the U.S. dollar in the interim but, for good or for bad, that is our view.
Equity/Bond Markets
Our focus of late has been on the relationship between banking stocks and gold prices. In a sense we have been trying to find a way to meld a few different views and arguments into a bullish outcome. We suspect that we have explained all of this before but we thought we would take yet another run at it.
The ‘decade theme’ argues that a major asset class tends to reach a peak early in the first year of a new decade. Obviously this time may well be different but until such time as that happens we are going to assume that one or more markets or sectors are going to start to weaken later this year before reaching a bear market bottom late in 2012.
The key question is… which markets are set to decline? The answer is… we have no idea. Well, we have a few ideas but not much in the way of conviction.
To really grasp the struggle that we are having with this imagine that there are only two choices- housing prices and gold.
We only have to go back to 2007 and 2008 to understand what would likely happen if U.S. real estate prices slipped back into a 2-year bear market later this year. If there is a bullish case for gold this would definitely be it.
If gold prices have been trending higher in response to a weak dollar, falling interest rates, and pressures on the financial sector then an outcome that involves lower gold prices suggests that the dollar is firming, yields are rising, and the sharply sloped yield curve is doing its part in creating low-risk profits for the banks. In other words the only bullish outcome that we can fit into the ‘decade theme’ argument involves falling gold prices.
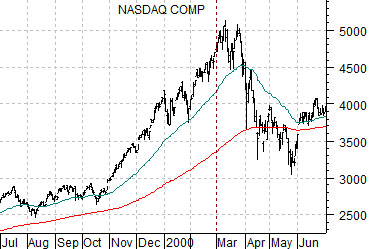
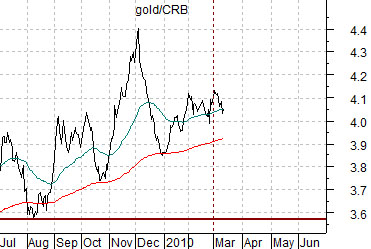
At top right we compare the Nasdaq Composite Index from 1999- 2000 with the ratio between gold futures and the CRB Index from 2009 to the present day.
The ‘decade theme’ suggests that a major asset class tends to peak during the first year of a new decade. Our interpretation of it has led us to argue that in 1980, 1990, and 2000 the first real ‘cracks’ began to show up in the month of March. This does not have to be the case but, then again, we thought it appropriate to at least point out the tendency.
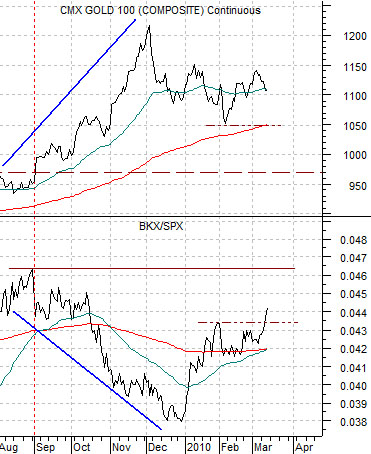
Our interest became somewhat piqued when the banking stocks (BKX) began to outperform the broad U.S. stock market at the start of the year. The chart below right compares gold futures with the BKX/SPX ratio.
To reiterate what we have already reiterated there are any number of markets that could turn lower this year and most of them would be positive for gold prices. The only market that could slip into a 2-year bear market and give us a truly bullish outcome would be gold itself so, being ever hopeful and occasionally delusional, that has been our focus over the past while.
Our concern is that if we concentrate too intently on falling gold prices we might end up missing the real story. As we approach the second half of this month we would be well advised to shift our thoughts from proactive back to reactive so that we are not too deeply dug in with this particular argument.