One of our recurring themes has been that downward pressure will come from Europe and Asia with upward pressure on cyclical growth emanating from gains in U.S. employment. The problem is that weekly U.S. jobless claims have tended to decline from September into March before drifting flat to higher into the following autumn.
We mention this because it is Thursday and Thursday means the release of yet another weekly jobless claims report. We understand that claims need to be somewhat below 350,000 before an improving labor trend will develop.
The bad news is that yields and cyclical asset prices may simply grind lower through the third quarter. The good news is that the markets have actually been trading in a positive manner since the end of May.
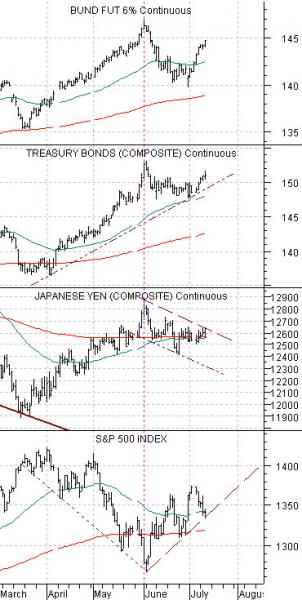
Below is a comparative chart of, from bottom to top, the S&P 500 Index, Japanese yen futures, U.S. 30-year T-Bond futures, and German bund futures.
If we focus on the S&P 500 Index and Japanese yen we might notice that the trend for equities has actually been positive since the start of last month.
The offset to this is the declining trend for the Japanese yen as money slowly moves away from ‘crisis destinations’.
The trend for the yen is confirmed to some extent by the lack of ‘new highs’ for long-term U.S. and German bond prices. Obviously the bond market has been grinding higher so far this month in response to a lack of positive news from the U.S. employment data but the argument is that the stock market can respond in a bullish manner to either flat or declining bond prices.
The bottom line here is that the S&P 500 Index has been limping to the upside ever since the bond market and Japanese yen rose to a peak roughly six weeks ago. As long as the sense of crisis does not escalate to the point where these markets spike to new highs it actually makes sense to be positive on large cap U.S. equities.
Equity/Bond Markets
The equity and commodity markets react to changes in interest rates in two different time frames which creates a series of cycles that help to make the markets more confusing than they probably should be. Cyclical weakness causes stocks, commodities, and yields to decline at the same time while cyclical strength pushes each of them higher. In real time the trends seem to be similar.
Cyclical growth also tends to lag changes in interest rates by roughly two years. For example the Asian crisis in the summer of 1998 pushed interest rates sharply lower which helped to create the peak for the Nasdaq into the autumn of 2000.
Another example might be the start of rising interest rates in the spring of 1987 which led to the stock market ‘crash’. The cyclical trend pushed right through the ‘crash’ with commodity prices peaking in 1989. The downturn in cyclical growth in 1989 caused- in our view- by the start of rising yields in 1987 preceded the 1990 equity bear market and 1991 recession.
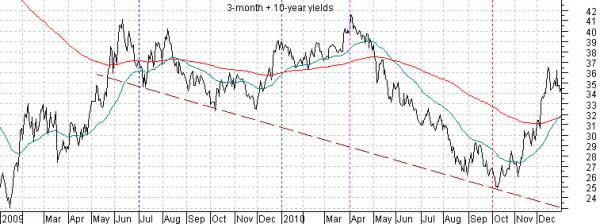
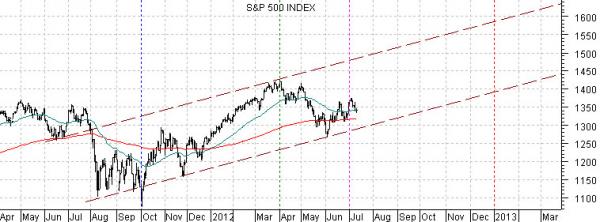
In any event… below is a chart of the sum or combination of 3-month and 10-year Treasury yields from 2009- 2010 and a chart of the S&P 500 Index from April of 2011 to the present day.
The 2-year lag argument suggests that the cyclical trend- represented in this case by the S&P 500 Index- trails changes in yields by roughly two years. The emphasis here is on the word ‘roughly’.
We have set up the charts so that the peak for short and long-term interest rates in mid-2009 is lined up with the low point for the S&P 500 Index in the autumn of 2011. In other words we are using a lag of 2 years and 3 months.
The idea is that 2011’s bearish trend was, in fact, a lagged response to the rise in yields into the middle of 2009. From this perspective we can make a leap and suggest that the current bearish trend may simply be a reflection of the upward pressure on interest rates that extended through the first quarter of 2010.
The charts have been set up to make a fairly specific point. In 2010 and 2011 the cyclical trend remained bearish through the third quarter so the markets seem to be trading off the assumption that the same outcome will occur this year. But will it? Based on this comparison we should be moving into a much stronger cyclical trend based on the rapid decline in yields that commenced in April of 2010. A literal interpretation would suggest that the second half of 2012 might well be stronger than most imagine possible.