We have a tendency to be ‘early’ with respect to many of our views. Often we are months- if not years- ahead of the trend. We suspect that our comments yesterday with regard to U.S. home prices is going to be a reasonable example of an argument that might best have been made a year or two from now. Then again… stranger things have happened.
From the L.A. Times: The most Americans in more than a year and a half signed contracts in November to buy homes, raising hopes that a boost in sales will follow, a real estate industry group reported Thursday.
An index of pending purchase agreements rose to 100.1 last month, up 7.3% from October, according to the National Assn. of Realtors.
The arguments are that over time the markets get to all sectors. Bonds rise, various equity sectors rise, commodity prices rise, and real estate prices rise. If a market isn’t ready to move higher due to questionable fundamentals prices can ‘crash’ (i.e. equities in 1987) but the adjustment tends to be temporary. After all… the S&P 500 Index is more than 5 times 1987’s post-crash levels.
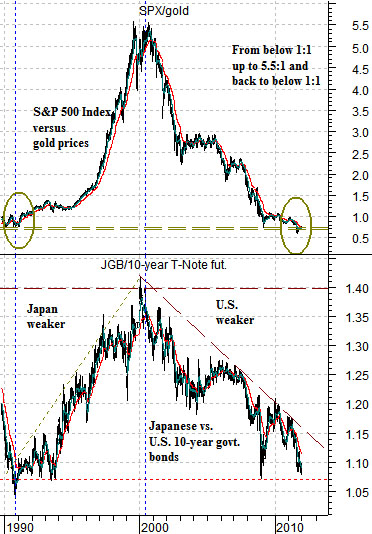
Below is a chart of the ratio between the S&P 500 Index and gold prices as well as the ratio between the Japanese 10-year (JGB) bond futures and the U.S. 10-year T-Note futures from the end of 1989 to the present day.
The ratio between the SPX and gold bottomed out in the autumn of 1990 very close to current levels. We are going to compare the 1990 situation on the following page with where things stand at present.
As the equity markets made a low relative to gold in 1990 the ratio between Japanese and U.S. bond prices also reached bottom. From that point forward Japanese economic weakness pushed the ratio higher until the Nasdaq made a ‘bubble’ top in 2000. The flow of money from Japan into the U.S. in response to falling Japanese asset prices helped lift U.S. asset prices as markets worked to arbitrage relative prices (i.e. falling Japanese asset prices, rising U.S. asset prices).
By 2000 the trend shifted from Japanese weakness to U.S. weakness. This led to a decade-long (and counting) trend that pulled the ratio of equities to gold lower along with the price of Japanese bonds relative to U.S. bonds. The argument is… that the recent weakness in gold prices and strength in the SPX/gold ratio marks the current situation as somewhat similar to the autumn of 1990.
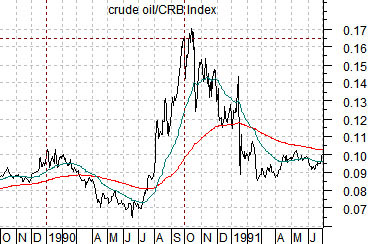
One of the defining details of the autumn of 1990 was the sharp rise in energy prices and concurrent decline in equity prices. Crude oil prices up, equity prices down.
The chart below shows the ratio of crude oil to the CRB Index from 1989 into 1991.
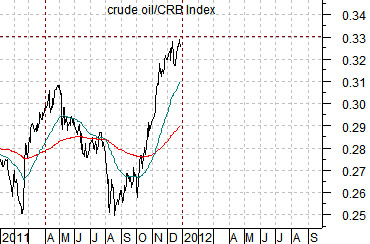
Below this we have included the same ratio from 2011 to the present day. The charts have been lined up based on calendar quarters with, for example, January 1, 1990 set above April 1, 2011.
The argument here is that equity markets pressures during the third quarter of 1990 (July through September) went with a sharp rise in the crude oil/CRB Index ratio.
The current situation is almost identical with the ratio spiking upwards from the end of September into year end.
Should be worry about Iran closing the Straits of Hormuz? We suspect not but, then again, we have been wrong before. Iran exports crude oil and imports refined products. Closing the Straits would seem akin to cutting off your nose to spite your face.
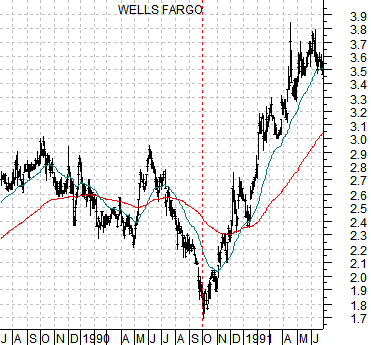
The autumn of 1990 was, of course, the peak point of crisis in the Gulf War. The chart below right features Wells Fargo (WFC) through this time period.
Notice that early in the new quarter (October) the trend reversed. Hard. WFC trended higher for the next number of years.
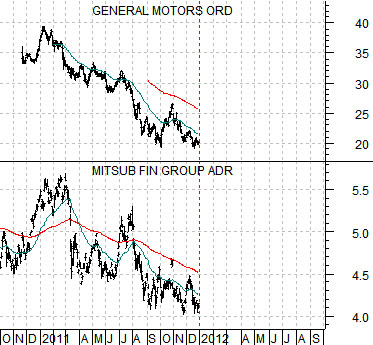
We were pondering the question of what kinds of stocks might be prone to pivot upwards in 2012. Obviously (we trust) this is only a guess but two candidates that came to mind were General Motors (GM) and Japanese bank Mitsubishi UFJ (MTU). We start a new quarter and year next week, are at some kind of potential peak for the crude oil/CRB Index ratio, and are seeing just enough U.S. dollar strength to make the argument for a weaker oil price trend.