What is more important- growth or value? Actually this is a trick question because the real answer is… momentum. Fundamentals and technicals can largely be thrown out the window when traders focus on a narrow theme and for much of this year the ‘beta trade’ has been where the action is. In other words… sell stable growth and buy cyclical.
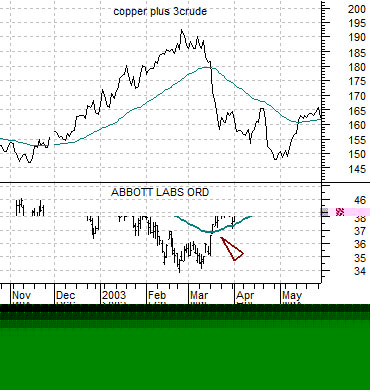
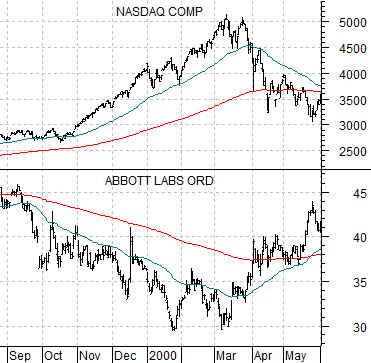
We use Abbott Labs (ABT) to measure the health of the ‘beta trade’ because it tends to trend lower when the markets get overly fixated on the cyclical theme. The chart at top right compares ABT with the Nasdaq Composite Index from 1999 into 2000 while the chart below right shows that ABT was begins squeezed lower as an offset to rising copper and crude oil prices into the first quarter of 2003.
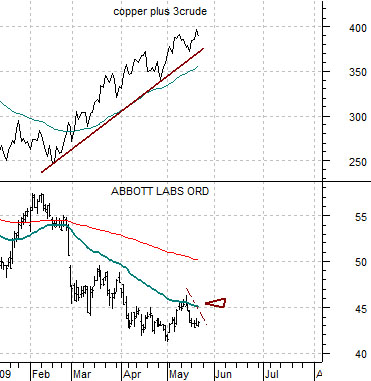
Traders have returned to the beta trade this year as copper and crude oil prices have risen (see chart below) while ABT has declined. This could persist for days, weeks, or even months but our view is that when it does come to an end we are likely to see the kind of bullish reaction by ABT’s stock price that characterized past cyclical momentum peaks.
Equity/Bond Markets
The oil market is… complicated. There is upward pressure from tight gasoline inventories and downward pressure from excessive distillate inventories. There is upward pressure from rising long-term Treasury yields (indicating economic recovery) and downward pressure from a weak natural gas market.
We have been following the energy price trend through the MACD indicator for the U.S. crude oil etf (USO). Possibly an overly complicated way of tracking a market but, as the chart at right attests, one that seems to mirror the concurrent recovery in China’s equity market.
The first point is that the energy price trend turned ‘technically’ positive late last October and has been on the rise ever since.
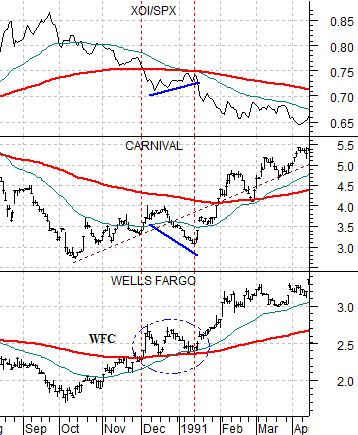
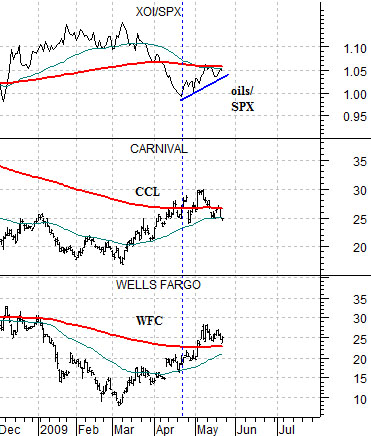
Below we show two comparisons based on the ratio between the Amex Oil Index (XOI) and the S&P 500 Index (SPX). Both charts compare the XOI/SPX ratio with the share prices of Wells Fargo (WFC) and Carnival Cruise Lines (CCL). The chart at bottom left shows the time period through the 1990 bear market while the chart at right is from the current period.
The argument is and has been that CCL and WFC should bottom as the XOI/SPX ratio peaks (which occurred last March) and then resolve higher as the major oils start to underperform the broad market. A second argument would be that in late 1990 into early 1991 the XOI/SPX ratio tracked back up to its 200-day e.m.a. line which served to pressure share prices lower.
The second point is that the downward resolution for the XOI/SPX ratio that we have been looking for will require a similar downward swing by the USO’s MACD indicator and, by extension, a period of weakness by the Shanghai Composite Index.