We stumbled across an argument yesterday in favor of a parabolic rise in gold prices based on a comparison between the rally for gold from 1968 into 1980, the bull market run for the Nasdaq from 1988 into 2000, and the start of the rising trend for gold prices back in 2001. As we understood it the argument was that based on the two previous 12-year cycles gold prices could move dramatically higher into 2013.
Our problem with this is that for as strong as gold prices have been over the past few years… gold is less of the dog and more of the tail. While gold prices did not begin to rise until 2001 the commodity cycle- powered by base metal and energy prices- turned upwards at the end of 1998. In other words…. close to 12 years ago.
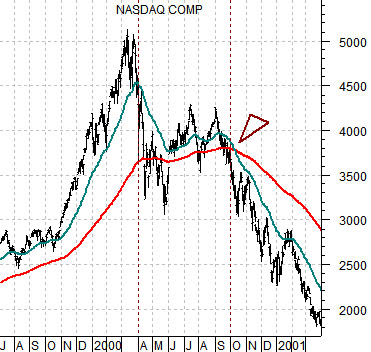
Below is a chart of the Nasdaq Composite Index from mid-1999 into early 2001.
The Nasdaq’s bull run began in earnest in 1998 following 1987’s stock market crash. The final stage of the rally occurred after the Asian crisis in 1998.
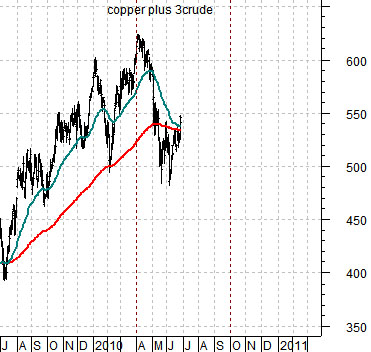
The chart below features the sum of copper futures (in cents) added to crude oil futures (in dollars times three). The 1:3 ratio is based on our view that over time copper prices in cents will tend to be roughly equal to 3 times crude oil prices.
The commodity cycle started in earnest around the end of 1998 after a 2-year outflow of capital from Asia and the BRIC themes created the Asian crisis that rolled through Russia and Brazil in the first few months of 1999.
Today’s argument is that if the Nasdaq rallied from bottoms in 1988 and 1990 while copper and crude oil moved higher from 1999 then a tentative case could be made that the commodity story is in a similar position today to the Nasdaq back in 2000.
With the Nasdaq peaking in late March of 2000 while copper and crude oil made a high in early April of 2010 the comparison is somewhat compelling. Notice how the Nasdaq broke below the 200-day e.m.a. line into May and then rallied back above the line through into September. If history were to repeat we could be looking at a fairly quiet quarter with a return to cyclical weakness and falling interest rates towards the end of this year or early in 2011.
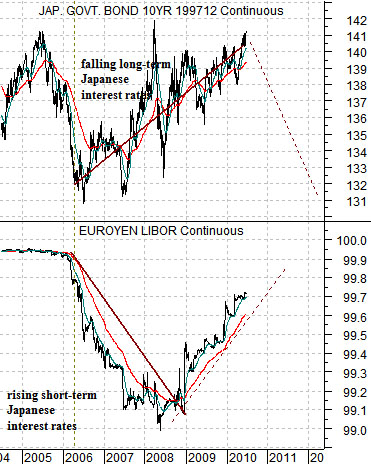
Below is a comparative view of long-term Japanese bond prices (10-year Japanese (JGB) bond futures) and short-term Japanese debt prices (3-month euroyen LIBOR futures).
There are any number of combinations of trends involving short and long-term debt prices but the most negative- by far- occurred between 2006 and 2008 in Japan.
In 2006 3-month euroyen futures prices began to decline after years of holding above 99.9. In other words short-term Japanese interest rates started to rise after a prolonged sojourn close to 0%.
The argument was that growth had become strong enough to allow for Japanese yields to move up from 0%. Copper futures prices, after all, were pushing 4.00 in 2006 while crude oil futures would not reach a cycle peak until mid-2008.
In any event… in yesterday’s issue we suggested that long-term bonds can lead short-term debt prices by as much as one year. Put another way the long end of the bond market is not going to follow central bank policy changes because it is, in fact, leading these policy changes.
Before we make a fairly simple argument needlessly complex we will return to the chart.
When short-term euroyen futures prices began to decline in 2006 long-term JGB futures began to rise. When short-term interest rates began to rise… long-term interest rates started to fall. Our view is that this is an extremely negative combination most especially because it led right into a financial markets crisis.
The next point is that we have been fixating in recent weeks on the Japanese bond futures. What we are looking for is, we suppose, the OPPOSITE reaction to 2006- 2008. What we are looking for is a period of time when Japanese short-term interest rates decline even as long-term yields rise. What we are looking for in particular is some kind of peak for the Japanese 10-year bond futures because our sense is that the rising trend is helping to push gold prices upwards as well.
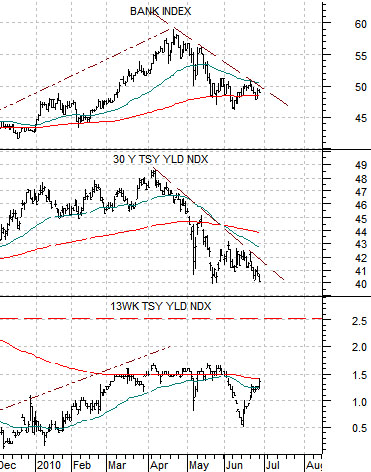
Below is a comparison between the Bank Index (BKX), 30-year U.S. Treasury yields, and 3-month TBill yields.
The Fed will raise the funds rate AFTER 3-month TBill yields move above .25% (2.5 on the chart).
The Bank Index is trended fairly closely with 30-year yields. As long as the bank stocks are trending lower we would expect that yields long-term yields will remain under pressure.
Our expectation has been that there is a limit to how steep the yield curve can get. Once 30-year yields rise to more than 4.5% above 3-month yields one of two things has to happen. Either short-term yields rise or long-term yields have to fall.
The point is that IF the Fed is going to raise the funds rate in the next year or so THEN 30-year yields will likely have to move back above 4.5% and likely to new recovery highs above 5%. That should be enough to push TBill yields above .25% and trigger a rate hike by the Fed.