The rising trend for gold prices reflects, we suspect, a general sense of mistrust and disdain for alternatives such as the U.S. dollar and euro. It is also related to concerns about the health of the banking system and, from an intermarket perspective, has its roots in the same trend that has been pushing commodity currencies like the Canadian and Australian dollars higher.
Our thought today is… what would it mean if gold prices collapsed through the second half of the year? In other words if gold prices declined from current levels down to around 550 into early 2011 would it be too much of a stretch to suggest that better times lie ahead?
The view is that the ratio between gold and the S&P 500 Index should decline from roughly 1.2 times today back to around .4 times into early next year. A quick back of the envelope calculation suggests that this would require gold prices close to 550 with the S&P 500 Index rising to around 1375.
Below we show a chart of crude oil futures from late 2005 into early 2009. Below right is a chart of gold futures starting in late 2007.
One of our ongoing arguments has been that trends have tended to reverse during the second half of the year. The trend for crude oil prices was relentlessly positive through the first half of 2008 but as the calendar shifted into July prices started to break.
The decline in gold prices on the first day of July hints at the possibility that the speculative investment flows that have been pushing gold prices higher are ready to move off in some other direction. As recently as 2008 we discovered that fundamentals are never as important as greed combined with the urge to maximize quarterly profits. One day crude oil prices were apparently heading into the 200’s and the next day they were plummeting down towards 40.
Our point is that the chart of gold futures into July of 2010 appears similar to crude oil as it made its peak into July of 2008. When contemplating what it might mean if gold prices declined all the way back into the 500’s over the next few quarters we had to conclude that it probably wouldn’t be a bad thing for the equity markets in general and the major financials in particular.


Equity/Bond Markets
We were asked years ago to put an assortment of intermarket relationships into a ‘black box’ trading system. Our reply was that it wouldn’t work simply because the markets don’t react to the same trend changes in the same way from cycle to cycle.
To explain… the equity bull market from 1995 into 2000 was driven in large part by corresponding bull markets in bond prices and the dollar. Yet the 2008 equity markets crisis went with the same combination of rising dollar and bond market. At times a strong dollar and falling interest rates will be a positive while at other times it will be a negative.
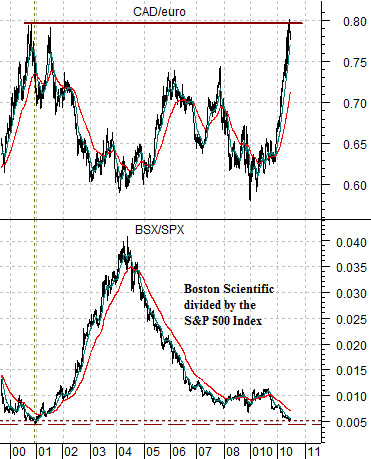
Below we show a chart of the ratio between the share price of Boston Scientific (BSX) and the S&P 500 Index (SPX) along with the cross rate between the Cdn dollar and euro (CAD/euro).
In late 2000 the CAD/euro rose to a peak around .80 while the BSX/SPX ratio fell to a cycle bottom close to .005.
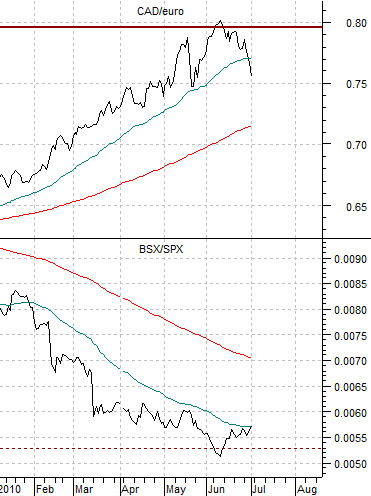
Into mid-2010 the CAD/euro rose back to .80 while the BSX/SPX ratio returned to the lows close to .0005.
The point is that a peak for the CAD/euro typically suggests some kind of top for commodity prices. In late 2000 copper and crude oil prices began to decline in a manner similar to what we have witnessed over the past few weeks this year. Late 2000 was also the start of an equity bear market that would run through into late 2002.
If the markets always responded in the same manner then the current positions of the CAD/euro and BSX/SPX ratio would lead one to conclude that we are poised on the edge of an imminent bear market. Fair enough.
Our view is that 2010 is significantly different from 2000. In 2000 the equity markets had just concluded a major bull market run while in 2010 the SPX has been consolidating relative to almost everything from cash to bonds to gold to commodity prices for a full decade. In 2000 valuations were expensive while in 2010 a case can be made that the SPX is undervalued by any where from 25% to 50%.
From a chart set up point of view the peak for the CAD/euro suggests the definite potential for commodity price weakness ahead. There have been times when commodity price weakness has been a negative for the equity markets and other times when it has proved to be a positive. If one views the equity markets from the perspective of the base metals miners or the oil producers then this would appear bearish but the basic materials sector is not ‘the market’.
Consider what kind of shift in the balance of power within the markets this might represent. Downward pressure on raw materials prices would hold interest rates lower while supporting valuations. It would be good news for the autos and airlines along with all of the companies that use raw materials to produce finished goods.
To the extent that downward pressure on commodity prices means lower gold prices- as we argued on page 1 today- then even we would be hard pressed to believe that the charts shown on this page would be a negative for the major banks and brokers. As well… it also appears likely that medical products makers such as Boston Scientific will do better as the markets shift focus away from the strong commodity price theme.