We noticed a head line yesterday that asserted that falling copper prices meant that stocks were going to tumble. We try to do a better job of avoiding these kind of head lines but this one managed to get past our defense shields.
The argument is that copper is being pressured lower by a rising U.S. dollar and since copper tends to trend with global economic growth its weakness has to be a negative for the equity markets. Which, by the way, is generally true. But not always.
If one has only been involved in the markets over the past decade or so then this actually makes perfect sense because there has been a fairly consistent relationship between copper and yields as well as equities and yields. In other words if copper trades lower with interest rates and equities trade lower when yields are falling then one can assume that weaker copper prices will result in weaker equity prices.
The twist is that since the end of the 1990’s the valuation levels for most U.S. large cap stocks have declined significantly. Companies that required constant growth to support stock prices are now ‘cheap’ compared to the current level of interest rates.
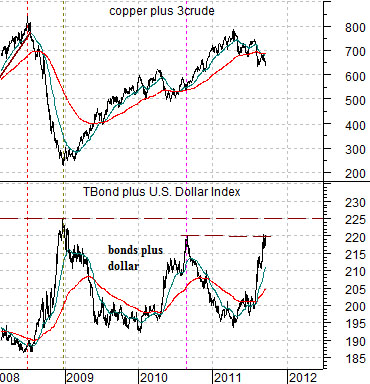
In any event… just below is a chart of the sum of copper and crude oil along with the sum of the U.S. 30-year T-Bond futures and U.S. Dollar Index (DXY) futures.
The argument is that a stronger dollar and bond market goes with downward pressure on base metal and energy prices. Fair enough.
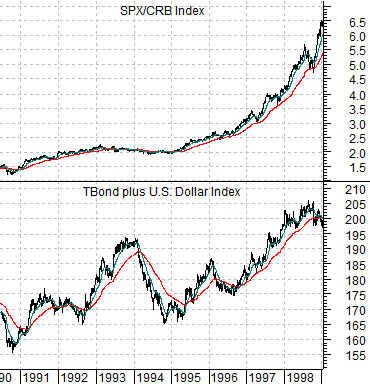
Below we show the sum of the TBond and Dollar once again along with the ratio between the S&P 500 Index and CRB Index (equities versus commodities) from 1990 through 1998.
The chart suggests that while a stronger bond market and dollar will most certainly put downward pressure on crude oil and copper prices it is not a given that it will lead to lower equity prices. What we do know is that it will lead to a rising equity/commodity ratio. After all, one of the strongest equity markets in recent decades occurred during the second half of the 1990’s in response to a very strong dollar and bond market.
Equity/Bond Markets
We are going to take one last (we hope) pass at the ‘end of the 1 year’ argument.
The Decade Theme argues that the markets repeat trends with different sectors from decade to decade. Asset price bubbles tend to occur through the ‘9’ year with peaks around the start of a new decade. Pauses take place in the 4’ year while crashes and crises tend to be herded into the ‘7’ and ‘8’ years.
In any event… our focus of late has been on the tendency for new trends to emerge around the end of the ‘1’ year. This seems somewhat relevant given that we are now approaching the final quarter of 2011.
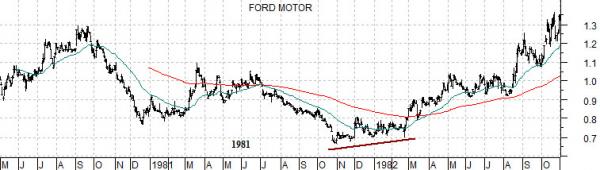
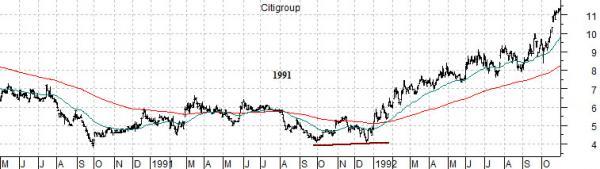
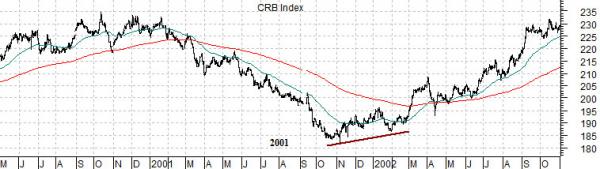
Below are charts of Ford (F) through 1981, Citigroup through 1991, and the CRB Index during 2001.
If we were to define the trend for the 1980’s we would say that it was consumer-based with an emphasis on the consumer cyclical sectors. For the 1990’s one could argue that the trend evolved into a tech and telecom trend although the early stages were dominated by the financials following the real estate-related bear market and recession during 1990 and 1991.
The 2000’s were definitely related to Asian or non-U.S. growth with an emphasis on raw materials prices.
The idea here is that Ford’s share price bottomed and turned higher in late 1981 even though the broad market did not swing upwards until the late summer of 1982. The share price of Citigroup lagged the early stages of the recovery but swung powerfully upwards during the final quarter of 1991. As well the CRB Index sagged to a bottom into late 2001 even though the S&P 500 Index remained under pressure will into 2002.
The point? This is about the time for early leadership to develop with the names that will help define the current decade’s trend starting to exhibit positive relative strength.