Our immediate problem (likely one of many) is that we really aren’t that bearish with respect to the equity markets. We realize that there is almost a rush out there to publish the most negative forecasts and projections and with long-term yields and growth-oriented asset prices grinding lower… not being all that bearish makes us feel somewhat lonely.
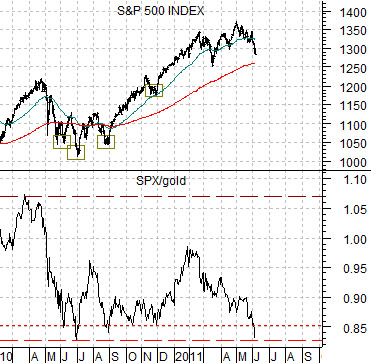
First is a chart of the S&P 500 Index and the ratio between the SPX and gold futures prices.
Over the last year or so there have been a handful of excellent entry points for long equity positions. There was a nice bounce in the SPX in May of 2010, a correction bottom at the end of June, and another low very close to the conclusion of the month of August. Other than that the last really good ‘get long’ point was around the end of November.
What do all four of these points in time have in common? The ratio between the SPX and gold was at or below .85. In other words through all of the assorted worries and crises that the markets waded through last year each time the SPX declined to 85% or lower of the price of gold… the SPX pivoted back to the upside.
So… the chart argues that the SPX/gold ratio has once again declined below .85. In fact it is only a smidgen above the lows reached at the end of June last year. The SPX is closer to 1300 than 1050, we grant, but the price of gold is also higher.
Obviously a bullish argument based off of the low point for the SPX/gold ratio relies on two factors. First, the ratio has to be ‘low’ and second, it has to pivot back to the upside.
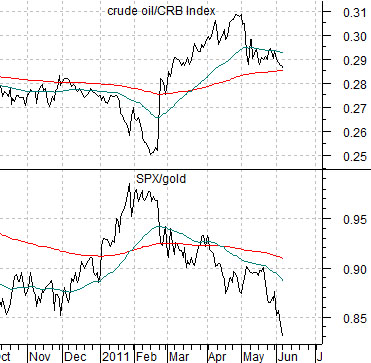
Next is a chart of the SPX/gold ratio along with the ratio between crude oil and the CRB Index.
Our view is that strong oil prices help drive the dollar lower and a lower dollar supports gold prices so, in a sense, there is a relationship between gold and crude oil that impacts both the dollar and the equity markets. The argument has been that the crude oil/CRB Index ratio was supposed to peak at the end of April this year. What is missing to date is a clear indication of the direction for crude oil prices going forward. The ratio has certainly weakened over the past few weeks but not far enough to wake up the SPX/gold ratio.
Equity/Bond Markets
Over the years we have made the argument on many occasions that the equity markets tend to lead the commodity markets. We have shown examples of what happens when equity prices in a sector diverge from the trend for underlying commodity. The argument is that if you have to trust one side or the other it usually makes sense to pay attention to the trend in the equity markets.
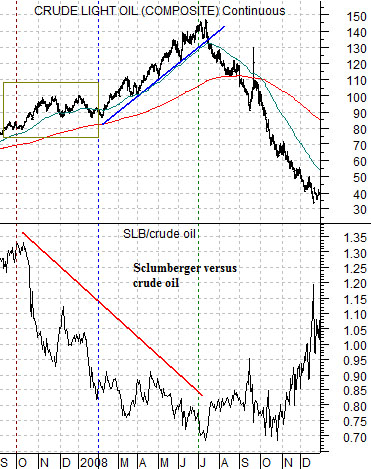
We have pulled forward the two charts that we have been showing over the last two days. Below is a chart of crude oil futures along with the ratio between oil service company Schlumberger (SLB) and crude oil from 2007 into 2008.
The argument here is that when the SLB/crude oil ratio began to decline in 2007 it made the case that there was something ‘wrong’ with the rising trend for crude oil. Obviously the ratio began to weaken close to 9 months before oil prices finally collapsed but the fact that it not only did so but continued month after month to do so suggested that eventually oil prices would have to move lower.
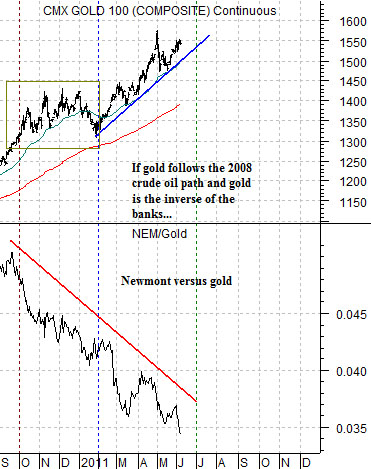
Below we show gold futures and the ratio between Newmont (NEM) and gold. Notice two things. First, NEM has been underperforming gold since the end of the third quarter of last year. Second, the gold futures chart is a dead ringer in many respects for the crude oil chart into 2008. And… we know how that one ended.
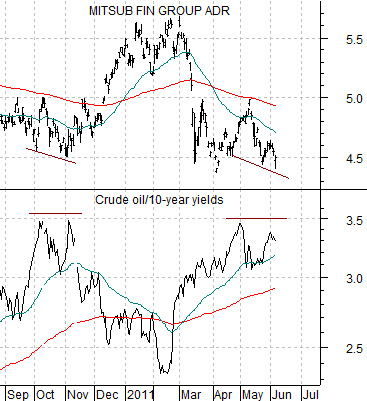
Our sense is that there are (at least) two problems with the markets at present. First, oil prices are ‘too high’. Second, long-term yields are still trending lower. If we combine these two issues into one chart we come up with the ratio between crude oil and 10-year Treasury yields. The comparison between this ratio and the share price of Japanese bank Mitsubishi UFJ (MTU) is featured below. The point? The ratio made a ‘double top’ late last year that went with a ‘double bottom’ for MTU. The ratio may be in the process of making a second ‘double top’ this year which, we will argue, opens up the potential for a much better equity markets trend later this month.