oday’s argument is that markets that peak in the summer tend to bottom in October.
We could probably have found more dramatic examples for our presentation today- the stock market ‘crashes’ in 1929 and 1987 come to mind- but for now these should suffice.
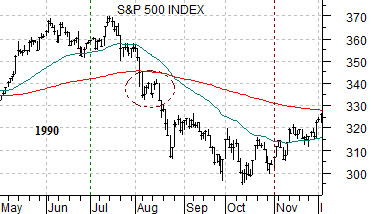
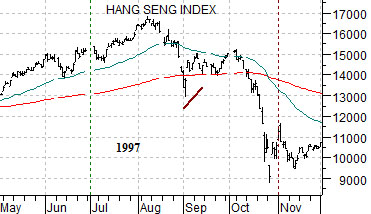
Below we feature the S&P 500 Index (SPX) from 1990 while at middle right we show Hong Kong’s Hang Seng Index from 1997.
In both instances a major equity market topped out in July or August before turning lower. The SPX entered a bear market in 1990 that extended through into October while the Hang Seng worked through what we like to call a ‘crash top’ extending through September before collapsing during October.
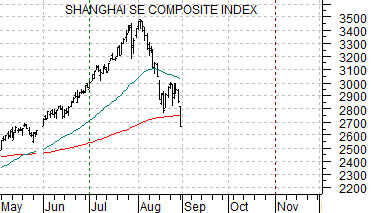
Below we have included a chart of China’s Shanghai Composite Index.
Now that the 200-day moving average line has been broken a number of things could happen in the short run. The Shanghai Comp. could take a page out of the 1997’s Hang Seng script and push back up towards 3000 saving the real drama for next month or it could extend the decline for another day or two in a manner reminiscent of the 1990 SPX.
The two points that we wanted to quickly make today are as follows. First, when a market peaks in the summer it tends to decline into October. Second, if the market holds below its 200-day e.m.a. line for three straight days it is more likely to continue to decline. Why? Because ‘break down failures’ tend to be reverse after two trading days. Around the end of August in 1997 the Hang Seng Index broke below its moving average line before rally upwards the following day and pushing well above it on the third day. In 1990, however, the SPX fell below its moving average line and then traded essentially flat for seven or eight sessions before continuing the decline.
Our thought is that the Shanghai Comp. is due to bottom out some time in October but whether it gets there in an orderly manner similar to the SPX in 1990 or in a heap of dust, ashes, and tears (1997 Hang Seng) has yet to be determined. Hopefully the issue will clear up somewhat by the end of this week.
Equity/Bond Markets
Aug. 31 (Bloomberg) — Crude oil prices fell the most in a month as Chinese equities led a global slump on concern a slowdown in lending may derail an economic recovery in the world’s second-largest energy consuming country.
Carts and horses, chickens and eggs. What leads and what lags?
When a trend runs long enough it may not matter but the point is that the equity market is supposed to lead while the commodity markets follow. In the midst of a commodity bull market, however, investors justify buying the shares of commodity producers based on underlying commodity price strength while in reality the shares are actually dragging commodity prices higher. Towards the end of the cycle as share prices start to weaken the typical response is to hold the shares simply because they are now ‘cheap’ relative to commodity prices even though those who have been around the block a few times might grasp the concept that if the leaders are moving lower sooner or later the laggards will follow.
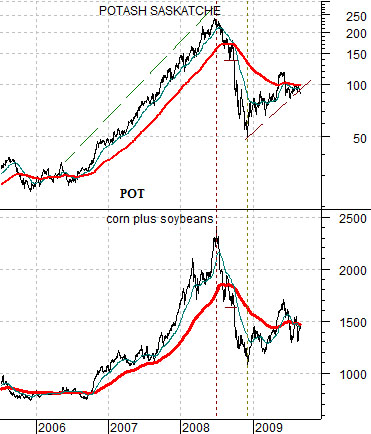
In any event… below we show the share price of fertilizer producer Potash (POT) and the combination of corn and soybean futures prices. The quick point is that from 2006 into mid-2008 the share price of POT was literally dragging grains prices upwards.
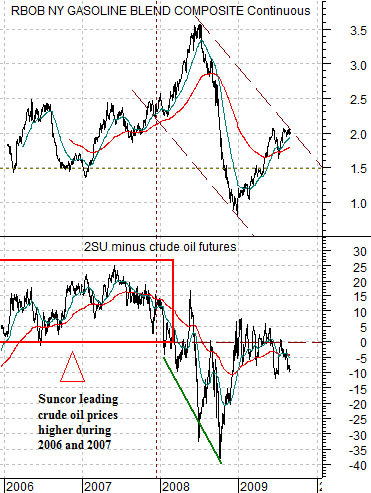
Below is a comparison between gasoline futures and the spread or difference between… two times the share price of Suncor (SU) and crude oil futures.
The argument is that Suncor has tended to trade around one half the price of crude oil. If we take two times SU and compare it to crude oil the spread should be zero if prices are in balance but between 2006 and the end of 2007 the spread was consistently positive as SU led energy prices upwards.
The trend began to tire in early 2008 as the spread line moved back down to ‘0’ before finally breaking into negative territory.
The point? If the equity markets lead the commodity markets then as long as the SU was greater than one half the price of crude oil the trend was ‘higher’ for energy prices. The equity markets led energy prices higher through the end of 2007 and then pulled them lower during the second half of 2008.
The difference between now and the time period in front of the mid-2008 commodity markets ‘top’ is that the equity markets are not clearly saying that commodity prices are on the rise. At best the equity markets are saying that commodity prices are neutral given the rally up to the 200-day moving average line for Potash and the similar push upwards for Suncor (chart on page 6).
We get lots of thing wrong and the odd thing right even after three decades or so of trying to understand the markets but the idea that we are trying to convey today is that one has to have a clear idea of what is leading and what is lagging. Cycle tops and trend changes are littered with the financial carcasses of those who thought that the commodity producers were ‘cheap’ based on underlying commodity prices or past earnings. The equity markets lead so it usually makes sense to trade the commodity markets off the equities instead of the other way around.