We are going to do something a bit different today as we burn the first three pages of today’s issue with charts focusing on the month of October. Perhaps this is a reasonable way to end the week, month, and quarter.
The argument is that there is a seasonal trend that overlays the markets creating different outcomes from year to year. The trend creates the impression of economic weakness into October/November and strength into April/May.
The seasonal trend works in concert with what we call the ‘decade trend’. The decade trend suggests that the markets do similar things in each year of a decade including a cyclical low in the ‘2’ year, a consolidation in the ‘4’ year, crashes and crises in the ‘7’ and ‘8’ years, a cyclical recovery in the ‘9’ year, and a peak in the ‘0’ year. Now… let’s push on to the charts.
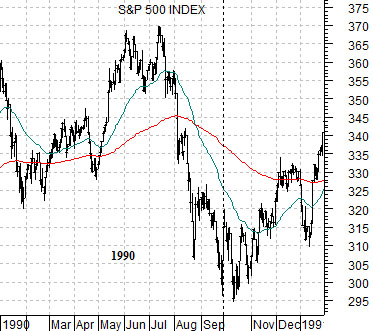
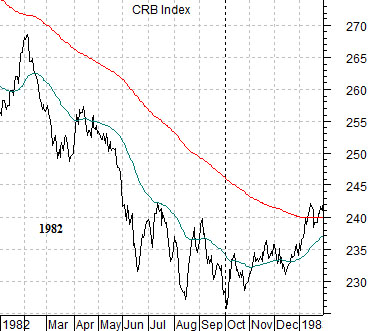
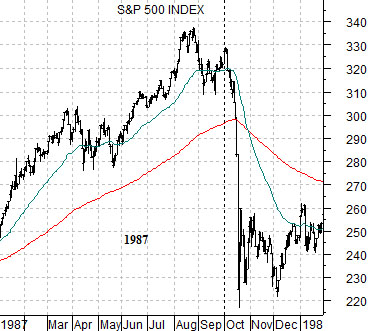
Below is a chart of the CRB Index from 1982. The cyclical trend bottomed with the commodity markets around the start of October. In 1987 (below right) the stock market ‘crashed’ in October setting both a high (August) and low (October) only a couple months apart. Below we show the 1990 equity bear market troughing out into October.
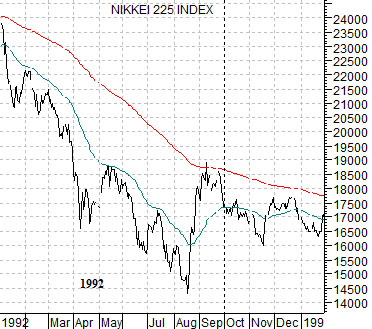
Below is a chart of Japan’s Nikkei 225 Index from 1992. The cyclical peak set in the ‘0’ year came from Japanese asset prices. The first significant price bottom for the Nikkei was made during the second half of 1992. Not precisely in the month of October but at least in the general ball park.
The Nikkei 225 Index declined from around 39,000 at the start of 1990 down to below 8,000 in early 2003. The only respite in the bearish trend took place between 1992 and 1997. In 1997 the Hang Seng Index from Hong Kong ‘crashed’ as the markets worked towards 1998’s Asian crisis.
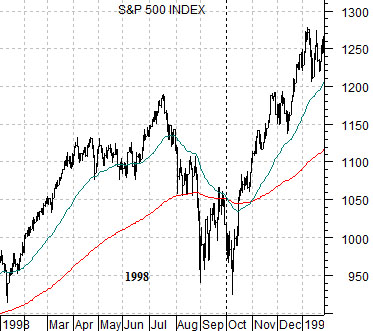
Below is a chart of the S&P 500 Index from 1998. Here were are attempting to show how the SPX made a bottom early into the month of October at the beginning of the end of the Asian crisis. The crisis would eventually drift from Singapore, Thailand, Indonesia, Malaysia, and the Philippines through to Russia and Brazil. Yet… the lows for large cap U.S. stocks were reached in October.
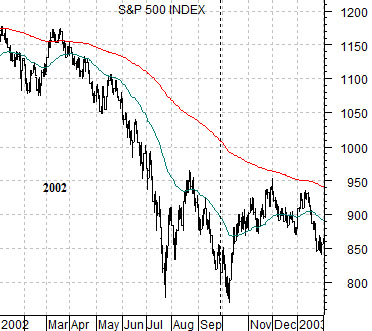
Below is a chart from 2002 of the S&P 500 Index.
We could also have shown the CRB Index making a bottom in October of 2001 in the weeks following the September 11th terrorist attacks but we only have so much space. Instead we have decided to show the way the stock market made at least one of its major bottoms into the first few days of October in 2002.
The point that we are circling has to do with what happens when the seasonal trend hits the decade trend. The seasonal trend argues that economic or cyclical growth will bottom out around the month of October. Perhaps this has something to do with business slowing through the summer and then ramping back up ahead of Christmas although some days we think it relates more to the depressing feeling in the northern hemisphere created by shorter days and colder temperatures.
The decade trend argues that the ‘2’ year tends to go with a major bottom in the cyclical trend so, similar to 1982, 1992, and 2002 this is the time of year and decade when one might expect to see the kind of extreme low in cyclical growth that would be associated in the current case with a generational low for interest rates.