In the back pages of the IMRA we often show a of Wal Mart (WMT) or the ratio between WMT and the S&P 500 Index (SPX). We thought we would once again explain what these are supposed to represent.
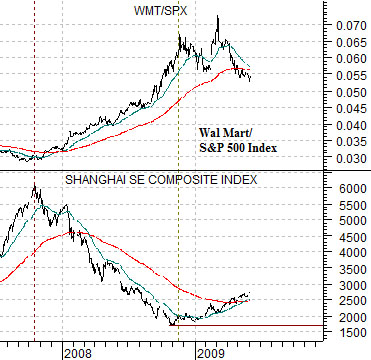
Wal Mart’s stock has shown a peculiar tendency to trend higher during periods of weakness for Asian growth, the commodity currencies, or commodity prices. In other words one would expect WMT to either trend lower or sideways during those periods of time when the markets are fixating on Chinese share prices, increasing metals demand, or strong commodity prices.
The below compares the Shanghai Composite Index with the ratio between WMT and the SPX. The obvious (we trust) point is that WMT outperforms the broad U.S. stock market when the Shanghai Comp. is declining and underperforms when it is rising. If a crack or two were going to appear in the ‘Asian growth’ theme then we would expect to receive confirmation through strength in the WMT/SPX ratio. Such was the case in trading yesterday but, then again, one day does not make a trend.
We are far to contrary for our own good and are, unfortunately, prone to wanting to take the other side of any trade that becomes popular with the masses. Such is the case with gold these days.
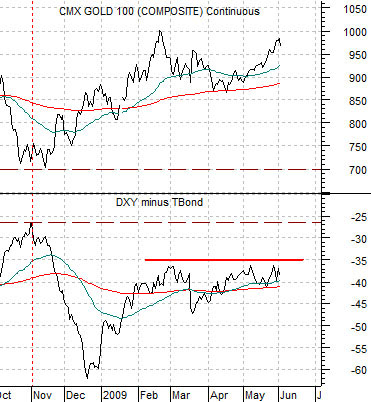
Gold tends to rise when the U.S. dollar is weaker and when interest rates are falling. When the dollar is weaker and bond prices are rising the trend for gold is usually quite positive. On the other hand a strong dollar and falling long-term Treasury prices is a marked negative for gold so we follow the spread between the U.S. Dollar Index (DXY) and U.S. 30-year T-Bonds quite closely.
The below compares gold futures and the DXY minus TBonds price spread. The higher the spread moves the greater the pressure on gold prices.
Our thought is that to even consider a ‘short gold’ view we have to- at minimum- see the spread rise above -35 which has shown up as resistance over the past 3 months. In trading yesterday both the dollar and the bond market were higher so the net impact on the gold trend was negligible even though gold futures prices fell rather sharply. We will wait patiently for this relationship to signal lower gold prices before getting too excited about a bearish gold price view.
Equity/Bond Markets
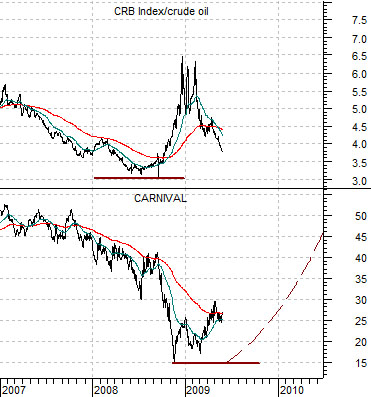
Over the past two quarters we have shown comparisons based on the ratio between the CRB Index and crude oil prices along with the share price of Carnival Cruise Lines (CCL) every month or so. Each time we have suggested that this is a trade that we like once we get into the third quarter. Since that time is rapidly approaching we thought we would run through it once again.
By way of explanation the CRB/crude oil ratio represents the relative strength of commodity prices compared to oil prices. When the ratio is strong and rising it means that energy prices are not dominating the cyclical theme and this is a positive for cyclical companies that are major users of energy.
We use CCL as a surrogate for the broader theme of ‘energy using cyclicals’ because the cruise ship business obviously does better when economic growth is expanding but will suffer when fuel costs are rising parabolically.
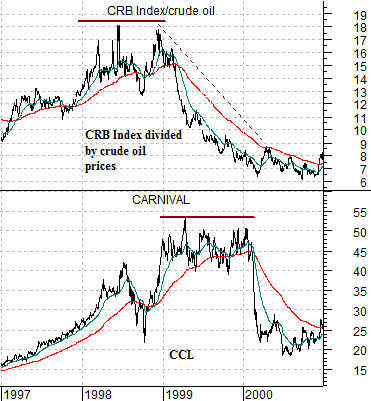
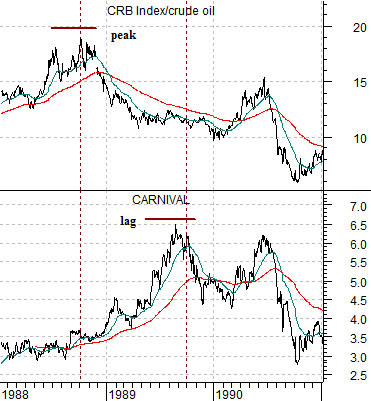
In any event… the s below show the two most recent cyclical peaks for the CRB Index/crude oil ratio. In both cases (1988 and 1998) the top for this ratio preceded a price top for CCL by close to one year. In other words the low point for oil prices relative to general commodity prices tended to lead the top for the ‘energy using cyclical’ theme by roughly 12 months.
The logical leap that we have made is that this relationship can and will work the other way around. The below shows that the CRB Index/crude oil ratio bottomed in mid-2008 (odd that major trend changes for oil prices seem to be made in the ‘8’ year- 1988, 1998, and 2008) which suggested to us that we could see a positive trend for the ‘energy using cyclicals’ develop during the second half of this year. Of course the argument relies rather heavily on the idea that the CRB/crude oil ratio will resolve to the upside this year although we have noted on many occasions that the first half of the year tends to go with a strong energy price trend.