March 1 (Bloomberg) — George Soros is helping drive up gold prices by doubling his bet in a market even he considers a “bubble” as Goldman Sachs Group Inc., Barclays Capital and HSBC Holdings Plc predict more gains before it bursts.
If the euro and Swiss franc have found support then we can envision a scenario that involves gold prices rising to new highs over the next few months. Our problem is that we just do not have the kind of conviction necessary to trade a bubble.
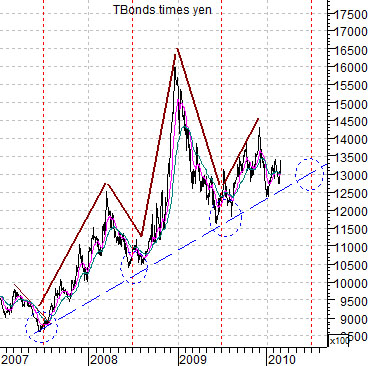
Below we show a chart of the U.S. 30-year T-Bond futures times the Japanese yen futures. The long end of the Treasury market and the Japanese yen have tended to serve as destinations for capital moving away from risk.
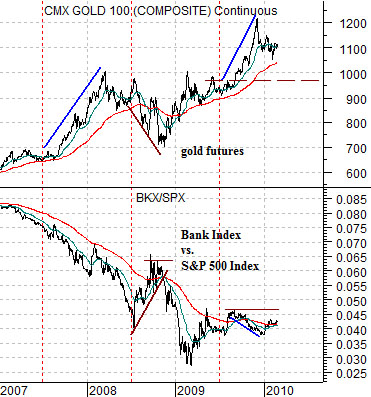
Next is a comparison between gold futures and the ratio between the Bank Index (BKX) and the S&P 500 Index (SPX).
We have set up both charts so that they cover the time period beginning in 2007 and running through to the present day.
We have argued over the months that there are two factors driving gold prices. The first, of course, has been the weaker U.S. dollar. It is generally accepted that central banks need to diversify their reserves into gold to offset the risks in fiat currencies.
The second source of strength for gold prices has been weakness in the global financial system. The argument is that when U.S. home prices began to decline in 2007 the BKX started to weaken relative to the broad U.S. stock market.
The points that we wished to make today are- hopefully- as follows. First, the trend for gold is similar to the trend for the TBonds times the yen. Gold, yen, and Treasury securities have benefited since 2007 from the pressures applied to the financial sector. Second, over the past three years the TBonds times yen combination has generally drifted lower through the first half of the year before accelerating higher in the third quarter. If history were to repeat we probably don’t have to worry about the next state of crisis until the second half of the year. Finally… short-term and nimble traders like Mr. Soros might do well buying gold at current levels but we shudder when we think about the prospect of China or India buying an asset class ensconced in a ‘bubble’ as a long-term hold.
Equity/Bond Markets
March 1 (Bloomberg) — U.S. stocks climbed, briefly erasing the 2010 loss for the Standard & Poor’s 500 Index, after consumer spending topped economists’ estimates and American International Group Inc. sold an Asian unit for $35.5 billion… while Intel Corp. helped lead technology shares higher after global chip sales rose.
The basic argument in favor of rising gold prices revolves around very low short-term interest rates. The risk associated with holding gold comes from a broad economic recovery sufficiently strong enough to push short-term interest rates higher while papering over the sins of the major financials.
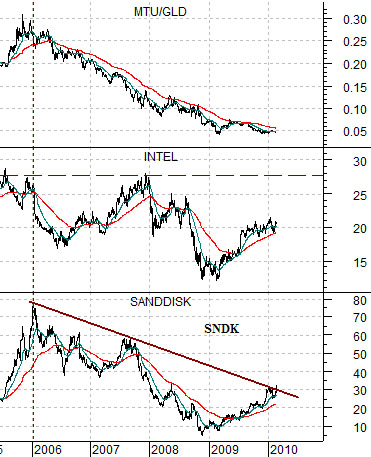
Below we compare SanDisk (SNDK), Intel (INTC), and the ratio between Japanese bank Mitsubishi UFJ (MTU) and the gold etf (GLD).
The real star yesterday was SanDisk. While it is difficult to see on the chart the price rise yesterday appears to have broken the down trend that began back in 2006. Our thought is that strength in the tech sector will be necessary if short-term interest rates are going to rise over the next few quarters.
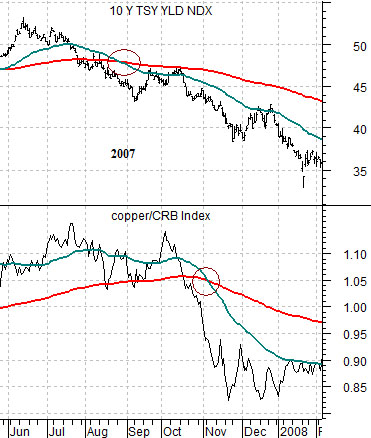
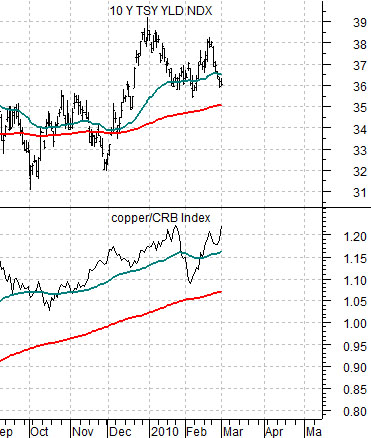
Further below is a comparison between 10-year U.S. Treasury yields (TNX) and the ratio between copper futures and the CRB Index from 2007 into 2008.
Our focus is on the two moving average lines. We have argued that we consider that the cyclical trend is positive until the moving average lines for one or both of these charts ‘cross’. In other words the moving averages lines might ‘cross’ without weakness in the cyclical trend but, on the other hand, if the lines have not crossed there isn’t too much to worry about. The lines crossed during the second half of 2007 but, as the chart below right attests, they have yet to do so this year.
