Will the Fed disappoint the markets? Will the European Central Bank hammer the euro bears into submission? Does any of it really matter?
Probably the best question is the final one. When ‘the markets’ sold off Asian currencies into 1998’s ‘crisis’ did it say much of anything about the long-term prospects of, say, Malaysia or Singapore? When capital flows forced Russia to default on its debt did it mark the end of growth for Russia? Or Brazil in early 1999? Our view is that the markets like to line up against central banks and then simply drive the trend until it becomes a crisis. The bigger the crisis and the more dramatic the central bank response… the more likely it is that the trend has run its course.
The point is that the absolute bottom for the U.S. equity market in March of 2009 was the exact low point for the recession. The peak for the bond market this time around will likely mark the worst point in time- perhaps measured in second or third derivatives- for the Eurozone crisis. To be long bonds and short the euro may be on the side of the trend but it is also the kind of trade that can go against you so quickly and dramatically that we prefer to stand aside.
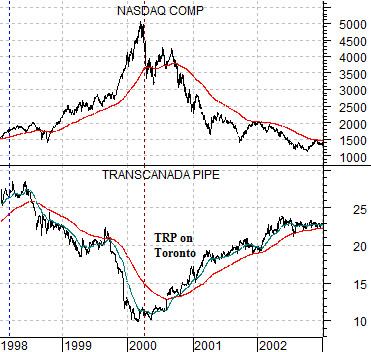
Which, strangely enough, brings us back to ‘offsets’. Below is a chart of the Nasdaq Composite Index and the share price of Canadian pipeline company Transcanada (TRP) from 1998 through 2002.
Most recall 2001 and 2002 as an equity ‘bear market’. That was certainly true for the Nasdaq but most definitely not the case for TRP. Money flowing away from large cap U.S. equities went with declining interest rates and strength in a variety of sectors including the Canadian banks, pipelines, and utilities.
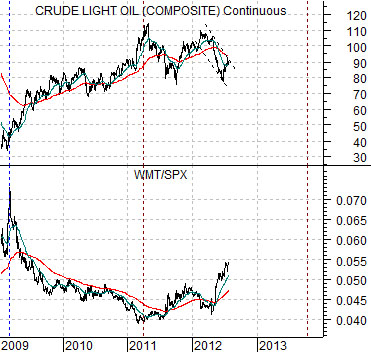
Next is a comparative view of crude oil futures and the ratio between Wal Mart (WMT) to the S&P 500 Index (SPX).
The WMT/SPX ratio is the offset to the trend for crude oil. We have argued that as long as the ratio is rising the underlying trend for energy prices is likely bearish.
If we compare the relationship between crude oil and the WMT/SPX ratio today to the Nasdaq and TRP in 2001… a case can be made that the trends could quite easily run well into 2013.
Equity/Bond Markets
We tend to use individual stocks to represent a variety of themes. So, right or wrong, when a stock is trending higher or lower it helps us to understand what is going within the various markets.
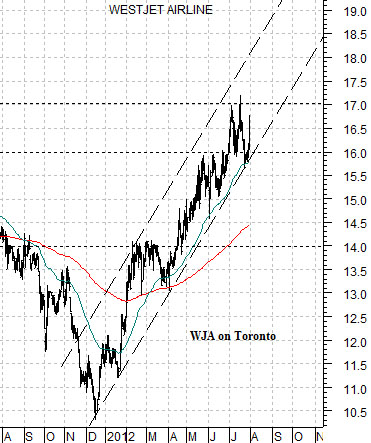
Below is a chart of Canada’s WestJet (WJA on Toronto). WestJet is somewhat of a growth story (a rare example of a profitable airline) but also trades off of energy prices. The argument is that when crude oil futures prices have stalled or turned lower the share price of WJA will tend to rise. Given that the ‘very strong energy price’ trend has been in effect since at least 2003 with a break to new all times for crude, Brent, and heating oil occurring in 2004 there haven’t been too many chances for WJA to take a turn moving higher.
The chart shows that WJA has been on the rise since the end of last year. The stock periodically stalls at ’round numbers’ (i.e. 14.00, 16.00, and most recently 17.00) but with corrections holding at the rising 50-day e.m.a. line the trend remains substantially positive.
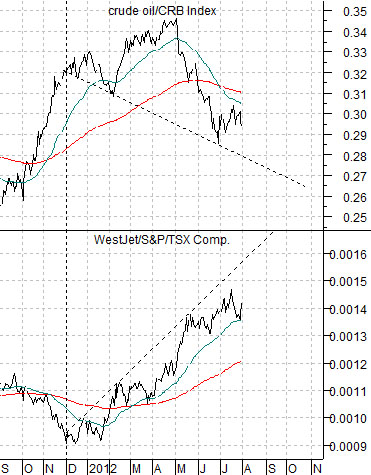
Below is a comparison between two ratios- the ratio of crude oil prices to the CRB Index and the ratio between WestJet’s share price and that of Canada’s S&P/TSX Composite Index.
From this perspective WJA has been under pressure since late 2003 in response to the powerful relative strength of crude oil. The WJA/TSX ratio declined from .0025 at the start of 2004 and has made a number of forays up to and then down from .0017. Given recent prices a rise in the ratio back to .0017 would put WJA into the 19- 20 range.
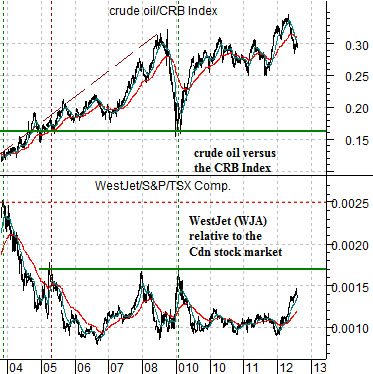
Below is a shorter-term perspective of the same chart. The point is that WJA is trending higher and this happens when energy prices are trending lower. Each time the WJA/TSX ratio extends up towards .0017 we conclude that the offsetting trend for the crude oil/CRB Index ratio is still lower. When a market- in this instance crude oil- is in a down trend then one shouldn’t be surprised if prices actually decline every now and then.