There are any number of reasons why natural gas prices are currently so low compared with crude oil prices. Increased production from unconventional shale fields in Texas and Louisiana and weaker industrial production are commonly used explanations but the point is that gas inventories are close to 20% above the 5-year average for this time of year and… growing.
Why are gas inventories expanding? Mainly because producers have the option of selling gas in the spot market for around 2.80 or storing it for delivery a year from now at 5.80 and with that kind of financial incentive one can easily understand why inventories keep rising.
If there is going to be a problem it should happen between now and October. There is a finite amount of gas storage capacity and it is conceivable that it could be filled this autumn which would lead to a dumping of excess gas on the spot market.
Aside from all of this our thought is that the current extreme levels of the ratio between oil prices and gas prices is directing the markets to ‘do something’. Specifically… find ways to substitute natural gas for crude oil with respect to U.S. consumer and transportation usage.
The point is that we have at present the highest price ratio between crude oil and natural gas in decades yet are almost incapable of taking advantage of it. One option would be natural gas-powered vehicles which represent a cleaner and safer alternative to conventionally powered vehicles. A second option would be electric or battery-powered vehicles charged on the electric grid which would, in turn, be fuelled by natural gas.
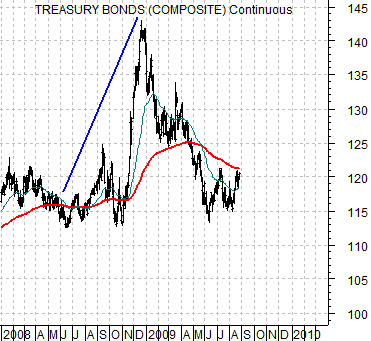
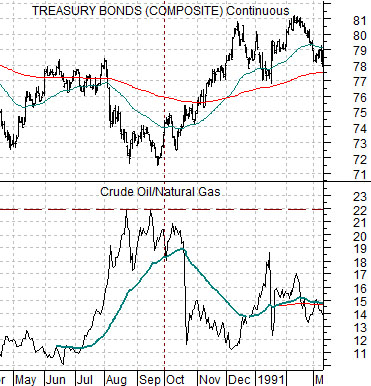
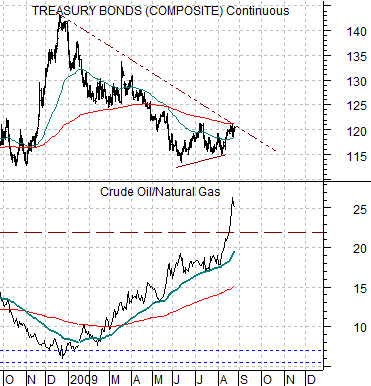
Our thought is that the longer the oil/gas ratio remains in the stratosphere the greater the momentum provided to the next generation of electric vehicles. U.S. transportation fuelled by domestic natural gas production instead of imported crude oil would, in effect, alter the flow of capital in an assortment of ways. Imagine a scenario where the U.S. heads towards energy self-sufficiency and consider how positive this could be for the dollar as the pendulum swings away from favoring the energy producers and back to the energy consumers. In any event… in 1990 (top right) the bond market bottomed at the peak for the crude oil/natural gas ratio which, we have argued, suggests that if the U.S. 30-year T-Bond futures break back above the 121-122 level the upward squeeze on the ratio through rising crude oil futures prices should be at an end.
Equity/Bond Markets
Our first page commentary was a bit of a meander but our actual point was that we are and have been intrigued by the potential for electric-powered vehicles and believe that an excess of domestic natural gas combined with OPEC’s determination to limit oil supplies to hold prices higher creates an ideal back drop for an emerging technology. If asked by OPEC- and, surprisingly enough, we haven’t been- we would tell them to get busy pumping because the greater the financial incentive to shift away from the product that they sell the greater the odds that the term ‘peak oil’ will refer not to production but to consumption.
In any event… we digress. In yesterday’s issue we commented that the decade from 1999 into 2009 favored not only the energy producers but also gold prices. In 1999 gold was 18% of the value of the S&P 500 Index and earlier this year it reached close to 140%. Our view was that the next decade would belong to the commodity users which served as the inspiration for our foray into impending automobile technology.
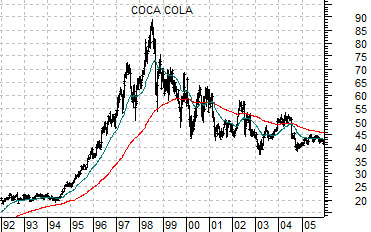
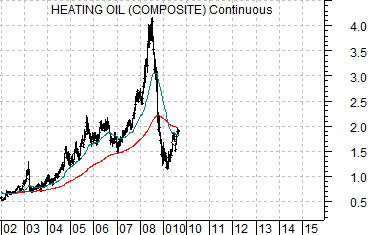
At top right we compare the share price of Coca Cola (KO) from 1992 through 2005 with heating oil futures from 2002 to the present day.
This one is going to take a bit of imagination but… imagine that the 1998 peak for large cap U.S. consumer stocks such as Coke has been replicated through the 2008 price peak for commodities in general and energy prices in particular. Imagine a world that does not include new highs for crude oil, gasoline, and heating oil for the next decade. Such a world, in our view, would be somewhat similar to the 1980’s which eventually led to an escalation of Japanese asset prices into a bubble peak in 1990.
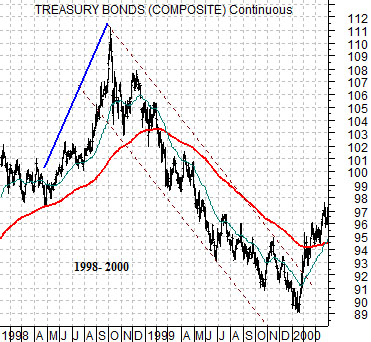
Following the price peak for Coke in 1998 the markets went into a period of crisis as Asian growth reached a bottom. This led to an upward spike in long-term Treasury prices as shown by the chart below. As long as we are flitting from topic to topic today our point is that ‘what followed’ the end of the crisis (i.e. the top for bond prices) was a major cyclical rally that drove the Nasdaq higher into 2000. Why was the theme dominated by cyclical themes? Because bond prices were falling. When bond prices decline- as they did consistently through 1999- the trend focuses on economically sensitive asset price themes including the Nasdaq, base metals, energy, Asia, and emerging markets.