We usually use this page for long-term chart comparisons and serious ‘macro’ thoughts but today we are going to drag forward two charts that we have been showing in the back pages. The time has come, it appears, to take a serious look at the here and now.
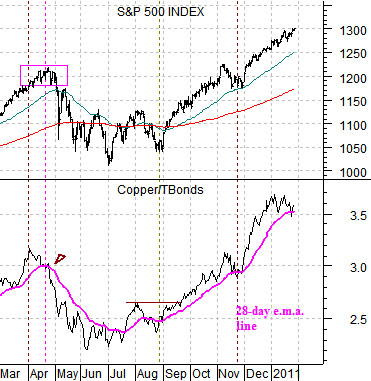
The chart below compares the S&P 500 Index (SPX) with the ratio between copper futures and the U.S. 30-year TBond futures.
The copper/TBond ratio rises when copper prices are stronger or when bond prices are weaker. The cyclical trend has included rising asset prices (copper) and falling bond prices (rising yields) and helped to power the stock market upwards.
The argument has been that as long as the copper/TBond ratio is rising the trend for the SPX will remain positive. The chart shows that with the exception of a brief dip in November the trend has been relentlessly bullish since late August of last year.
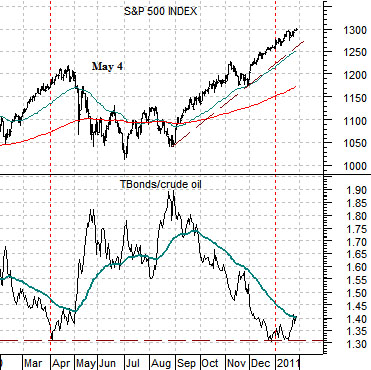
Below we show the SPX and the ratio between the U.S. 30-year T-Bond futures and crude oil futures. This is a fairly similar ratio to the copper/TBond except that is turned upside down.
In this case a positive stock market will go with a falling ratio while a negative stock market goes with a rising ratio. In particular a bottom for the ratio followed by a strong push up through the 50-day e.m.a. line is the sort of thing that one might look for to indicate that the equity markets are on the verge of slumping lower.
So… the copper/TBond ratio is right on the edge. It has fallen to its moving average line and has held there over the last few days. The TBond/crude oil ratio is also on the edge as its bounce up from the bottom during the second half of January puts it in a similar position to April of last year.
When all is said and done the bottom line is that the SPX could easily decline back to 1250 or even down to 1170 if we continue to see weakness in copper and crude oil prices while bond yields turn lower. On the other hand the relationships are so closely balanced on a decision point that we could just as easily see a resumption of the rising trend through the rest of the quarter. It may not be a true coin toss but from a number of perspectives it isn’t that far from one either.
Jan. 27 (Bloomberg) — Crude oil fell to an eight-week low in New York, and slid to a record discount versus London’s Brent, as a bigger-than-forecast gain in U.S. jobless claims bolstered concern that the economy will be slow to recover.
Futures dropped 1.9 percent after Labor Department figures showed applications for jobless benefits rose 51,000 to 454,000 last week.
The bond market remains hostage to the weekly jobless claims report as 10-year Treasury yields bounce back and forth between 3.3% and 3.5%. As mentioned in yesterday’s issue there are a number of offsetting cross currents working on the bond market this month.
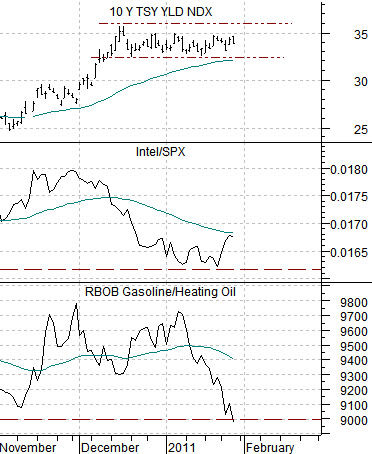
Below we show 10-year Treasury yields, the ratio between Intel and the S&P 500 Index, and the ratio between gasoline and heating oil futures.
There has been downward pressure on yields from a tepid tech sector and cold weather for the eastern U.S. It is, of course, January and there is always a cold snap around this time of year that encourages traders to chase heating oil and natural gas.
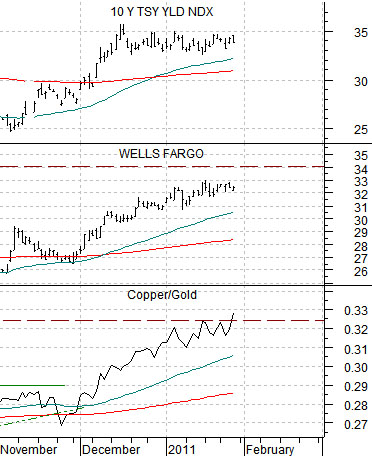
Below we show 10-year Treasury yields, Wells Fargo, and the ratio between copper and gold. The copper/gold ratio continues to point to upward pressure on yields as WFC grind back up towards resistance around 34.
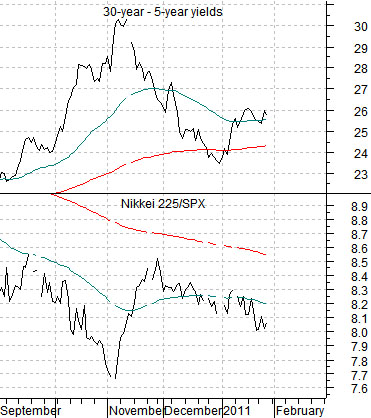
Our ‘laggard bank’ argument revolves quite tightly around the yield spread. Our view is that the ‘laggard bank’ trade is very similar to the ‘Japan’ theme so any strength in the ratio between the Nikkei compared to the SPX is an positive. The problem is that yield spread has been widening somewhat through January putting downward pressure on the Nikkei/SPX ratio. If we hit the bottom for the ‘laggard banks’ during the final quarter of last year then the yield spread has to resolve lower over time.