From minute to minute and from day to day the markets move in such a haphazard manner that it is often difficult to see the forest for the trees. Experts write and say the same things over and over again until we all know that they must be true. In fact… one of the hallmarks of any trend is that right about the time that it is broadly recognized… it is on the verge of ending.
Our presumption is that strong energy prices in particular and Chindia-centric demand for raw materials are two of the themes that most now accept as a given. We grant that both themes have represented the ‘core trend’ of the markets for many years now but we can also make something of a case that both are actually right on the edge of dropping by the way side. To explain we have included the two charts at right.
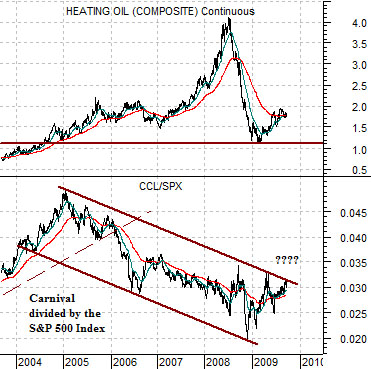
The top chart below compares heating oil futures (representing energy prices) and the ratio between the share price of Carnival (CCL) to the S&P 500 Index (SPX).
The argument is that the CCL/SPX ratio began to trend lower back in 2004 as heating oil futures broke above the highs set in the early 1980’s. As long as the energy theme remains positive the CCL/SPX ratio should hold within its downward sloping channel. Obviously the ratio has yet to break to the upside- although it was a near thing this week- but our thought is that this chart represents a theme holding on by the barest of margins.
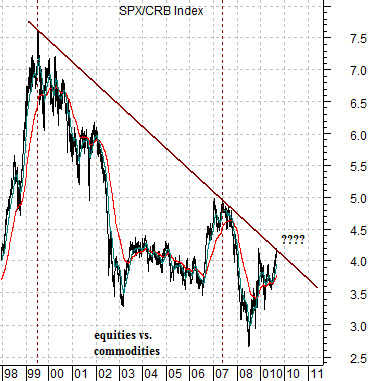
What about commodities or raw materials as an investment class? Certainly that has been all the rage over the past few years. The chart at right shows the ratio between the S&P 500 Index and the CRB Index (equities vs. commodities).
The ratio has been falling since 1999 which was around the time that the markets began to abandon large cap consumer and pharma names such as Coca Cola. For the past ten years the trend has favored commodities over equities so it is not too difficult to understand how a decade-long trend could create the widely held belief that raw materials should be included in investment portfolios. The problem is that now that the theme has been fully and broadly embraced… it may be right on the verge of changing as the equity/commodity ratio threatens to move back up through the trend line that has served as resistance and defined the trend since its inception at the end of the last decade.
Equity/Bond Markets
Before pushing on we will attempt to quickly summarize our page 1 comments. The CCL/SPX ratio is jammed into the top of a trading range or channel that began to from back in 2004 when energy prices pushed to new highs. Our view is that if this ratio breaks through the channel top it will mean that energy prices are expected to remain dormant for at least the next few years.
The equity/commodity ratio has been rising this year but has yet to move above the resistance line. If it does then we would expect that equities are set to outperform commodities for a reasonably lengthy stretch of time. Likely right up until the point in time when we all know once again that commodities have no place within investment portfolios.
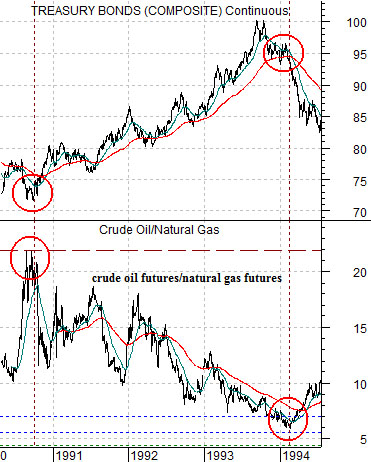
Below we show a comparison between the U.S. 30-year T-Bond futures and the ratio between crude oil and natural gas futures from 1990 into 1994.
The oil/gas ratio last pushed above 20:1 in 1990 ahead of the Gulf War. We have argued on many occasions in the past that significant bottoms for crude oil prices tend to occur when the ratio declines below 7:1. We will return to this detail in a moment or two.
The crude oil/natural gas ratio peaked in 1990 at the bottom for the U.S. 30-year T-Bond futures. In other words in the autumn of 1990 the price of crude oil was extremely ‘high’ and this went with a bottom for bond prices and a peak for long-term interest rates. Fair enough.
It took roughly 3 1/2 years to pull the ratio down from its top over 20:1 to its bottom below 7:1. The chart shows rather clearly that as the ratio slowly worked lower the trend for bond prices was higher. The bottom for bond prices went with the peak for the ratio while the eventual top for bond prices went with a sub-7:1 reading for the ratio. Once again… fair enough.
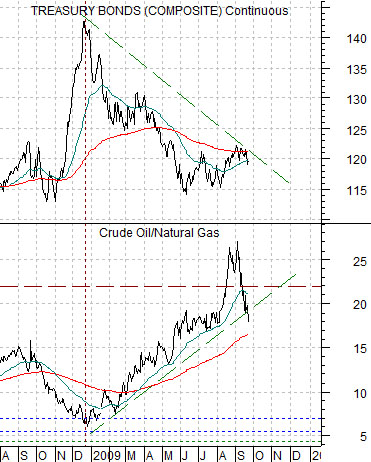
The markets have somewhat… bizarre… over the past year or so. To explain we don’t have to look much further than the oil/gas ratio.
We argued last year that crude oil prices were set to collapse and we showed on a number of occasions how oil price bottoms tend to be made when the oil/gas ratio falls below 7:1. The chart at bottom right points out that the ratio actually declined to less than 7:1 in December which ‘set’ the bottom for oil prices.
The argument is that ratio bottoms below 7:1 go with significant bond market price top (like 1994) while ratio tops in excess of 20:1 go with equally significant bond price top (like 1990).
In the space of only a few quarters the crude oil/natural gas ratio swung from an extreme that argued that bond prices were at a cycle top to another extreme that suggested that bond prices were at a cycle bottom. Instead of trending and grinding for years the entire process was telescoped into something less than three quarters.
The point? A crude oil/natural gas ratio declining from well over 20:1 tends to go with rising bond prices. If we see the TBond futures push above the recent highs around 122 our view is that bond prices will continue to rise- unless, of course, the crude oil/natural gas ratio collapses back under 7:1 later this year.