The argument is that the markets are on the verge of a major trend change. The problem is that there is some difference between being ‘on the verge’ of a trend change and an actual shift in trend.
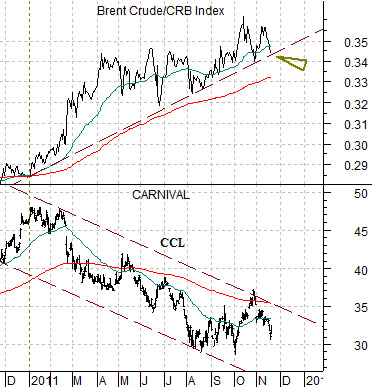
First is a chart comparison between Carnival Cruise Lines (CCL) and the ratio between Brent Crude oil futures and the CRB Index.
The idea here is that CCL represents the ‘energy using cyclical’ theme that has been under pressure since late 2010 as Brent crude oil prices have risen relative to the CRB Index. As long as the Brent/CRB Index ratio continues to resolve to the upside the broad ‘autos and airlines’ theme will remain bearish.
At the end of last week we noted two small details within the markets. First, Brent and gasoline futures prices continued to weaken. Second, long-term Treasury yields failed to make new lows as the European debt crisis swept from one country to another.
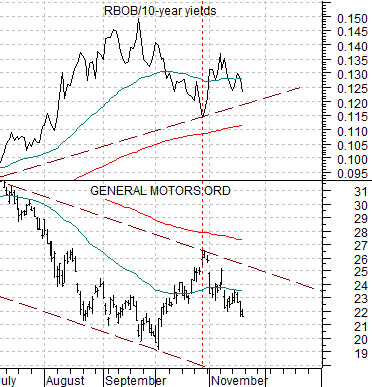
The end result was a small decline in the ratio between gasoline (RBOB) and 10-year Treasury yields. This ratio is another way of measuring the trend for the ‘energy using cyclical’ theme.
Next we show the gasoline/10-year yields ratio along with the share price of General Motors (GM). Notice that the ratio declined to support in late October as GM rose to its channel top.
The point is that the Brent crude/CRB Index and gasoline/yields ratios represent the pressures that have been weighing on the energy using cyclical sectors. As long as these two ratios continue to trend higher we will continue to see a bearish trend for those groups that tend to be negatively impacted by high and rising fuel costs.
The reality is that the trend has not yet changed but each time the Brent crude/CRB Index declines to the rising support line our hope that something new is set to begin increases. It wouldn’t take much in the way of downward pressure on energy prices along with flat to rising long-term Treasury yields to create the kind of major trend change that would make the last few weeks of the year just a bit more exciting.
Equity/Bond Markets
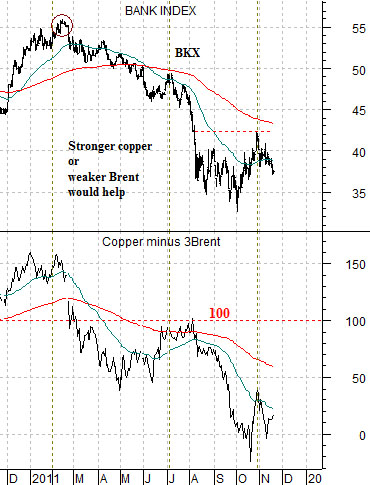
A strong cyclical trend will tend to push copper and energy prices higher. The problem is that stronger copper prices tend to be a positive while rising energy prices are ultimately a negative.
Early in a cycle copper tends to be stronger than crude oil while towards the end of the cycle energy prices tend to dominate. At right is a chart of the Bank Index (BKX) and the spread between copper (in cents ) and 3 times the price of Brent crude oil (in dollars).
The argument here is that a bearish trend for the banks goes with weaker copper than Brent crude. To get back to a better equity markets trend we either have to see strength in base metals prices or… weakness in energy prices.
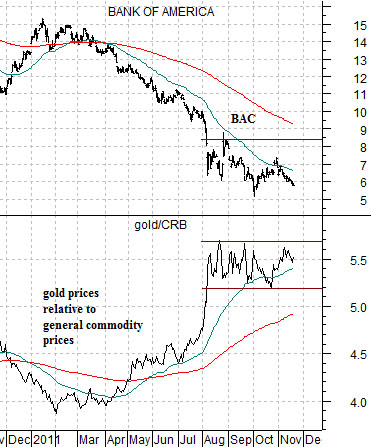
Below is our comparative view between Bank of America (BAC) and the ratio between gold and the CRB Index.
The argument is that these are mirror images. The stronger the trend for gold relative to general commodity prices the weaker the trend for the laggard banks. And vice versa. To get back to a more bullish trend for the banks we still need to see the gold/CRB Index work lower.
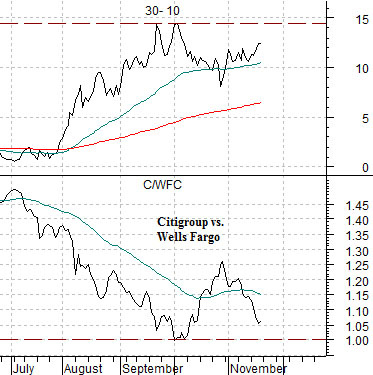
Below is a chart of the price spread between the 30-year and 10-year Treasury futures (30- 10) and the ratio between Citigroup (C) and Wells Fargo (WFC).
The 30-10 spread rises with the bond market. The spread has risen as the sense of crisis deepened. The twist is that it has yet to rise above the recent peak.
The C/WFC ratio represents the action between the laggard banks (C) and the leading banks (WFC). In a recovery the ratio should rise as the markets become more confident in the future potential of the laggard banks. This ratio made a bottom at 1:1 at the end of this year’s third quarter which represents one of the ‘lines in the sand’ for the current recovery.