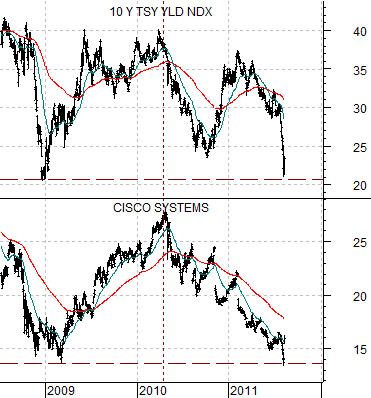
After more than a year of gapping down following the release of quarterly earnings the share price of Cisco surged higher yesterday. This was one of the two factors that helped to pivot equities higher and bonds and gold lower yesterday.
Below is a chart of 10-year U.S. Treasury yields and the share price of Cisco (CSCO).
The argument is that CSCO has been trending lower since the start of the series of Eurozone crises back in the second quarter of 2010. With CSCO and yields testing the lows made in early 2009 the bullish response helped lift equity prices.
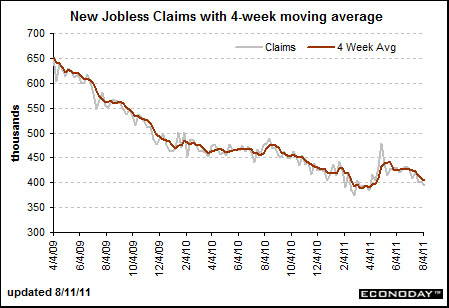
We also had the release of the weekly U.S. jobless claims numbers ahead of the opening of trading yesterday. We have argued on a number of occasions that the markets have been trading off of this particular piece of economic news. From the Econoday.com web site we include the following comments:
Initial jobless claims, for the first time since early April, are under 400,000, at 395,000 in the August 6 week in what is a positive indication of job market improvement. The four-week average of 405,000, down 3,250 in the week, is the lowest since mid April and is down now for the sixth week in a row. A month-ago comparison with early July shows a 13,000 decline in what hints at improvement for the August employment report.
The bottom line is that the markets have recently been discounting an awful lot of potential bad news. If the U.S. is not, in fact, heading into recession then the path of least resistance for equity prices would obviously be higher. At the very least the markets had moved to the edge of the abyss with 10-year yields declining down towards 2.0% only to discover that there is a chance that the light at the end of the tunnel is not an approaching train.
While only one day… we were heartened and encouraged by the way prices reacted and adjusted yesterday.
Equity/Bond Markets
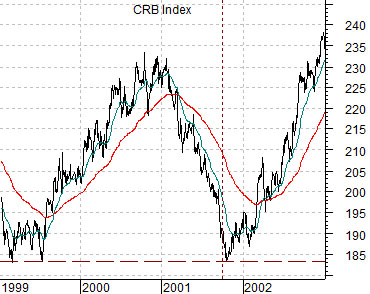
We have argued that the trend for the Nikkei 225 Index at present is similar to the trend for the CRB Index during 2001. This is, we believe, a critical point in time for this thesis.
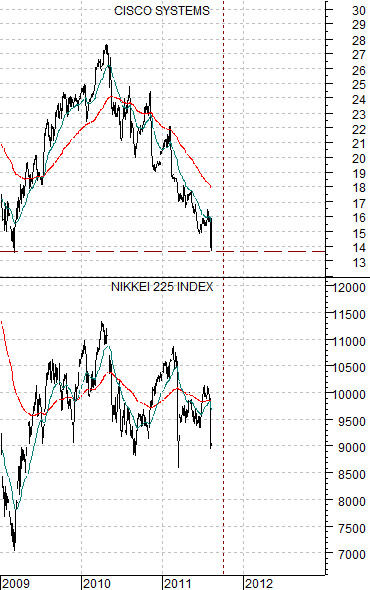
Just below is a chart of the CRB Index from 1999 through 2002. Below right we have included a chart of Cisco as well as the Nikkei 225 Index from 2009 to the present day. We are comparing CSCO and the Japanese equity market today with the CRB Index from ten years previous.
The CRB Index bottomed in early 1999, rose through 2000, and then circled back to test the lows into the autumn of 2001.
The idea has been that if the Nikkei followed a similar path then it could decline back to the 2009 lows into the final quarter of this year before finally swinging back to the upside. The problem with this is that commodity prices actually turned higher coming out of 1999 and after slumping through 2001 soared back up ‘on trend’ in 2002. If the Nikkei is already in a bullish trend then there is some danger involved in waiting for ‘one more sell off’.
The detail that caught our attention was the sharp rally for Cisco after the retest of the 2009 lows. The chart appears quite similar to that of the CRB Index. If Cisco were to continue to rise then the next time the Nikkei pushes above 10,000 (a level that we view as important) may prove to the last time we see this index at current levels for quite some time.
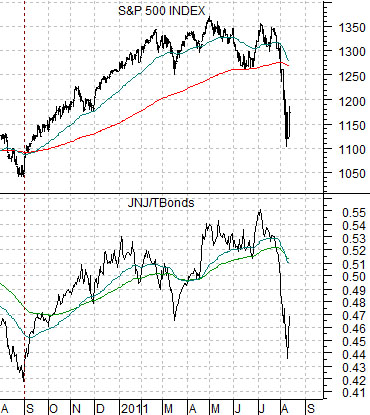
Below is a chart comparison between the SPX and the ratio between Johnson and Johnson (JNJ) and the U.S. 30-year T-Bond futures.
The JNJ/TBond ratio tracks with the SPX. The difference between yesterday and recent stock market bounces can be seen in the way the ratio pivoted higher. The ratio suggests that yesterday’s rally was actually quite ‘real’.