In yesterday’s issue we introduced the idea that we may well be in a one-quarter crisis market trend. The problem is that in recent years we have witnessed a number of two-quarter energy price trends that have dominated the markets over the first six months of the year. The closer we get to the end of this month the more important this topic is going to be.
In 2006, 2007, and most definitely 2008 energy prices drove higher over the first half of the year only to flatten out or decline during the last six months. 2008 served as an excellent example as crude oil futures prices rose from under 90 in January to 147 at the start of July before tumbling back to around 40 by year end.
Another part of this argument was that each of these two-month trends was led by something other than crude oil with markets like gasoline, natural gas, and even coal doing the heavy lifting.
In the current situation crude oil (WTI) futures are being pushed upwards by Brent crude. While U.S. energy stocks are at or above 5-year average levels- a situation that one might think would lead to lower instead of higher prices- the market has the bit in its teeth and is pushing prices to the upside.
If this proves to be a two-quarter energy price trend then it should be onward and upward through into June. Our problem with this is that it also looks very similar to past one-quarter ‘crisis’ trends as energy prices benefit from unrest in the Middle East and North Africa.
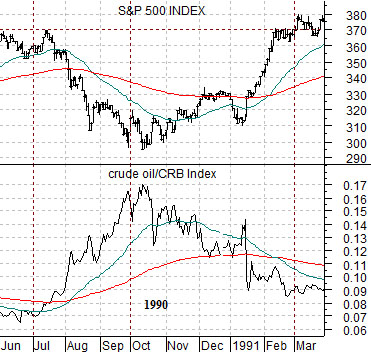
At top right is a comparison between the S&P 500 Index and the ratio between crude oil and the CRB Index from 1990. Notice that the ratio between crude oil and general commodity prices shot skyward in the months leading up to the Gulf War with the broad U.S. equity market declining as an offset.
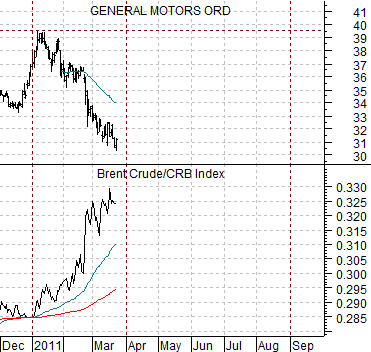
Below right is a chart of General Motors (GM) and the ratio between Brent crude and the CRB Index.
To the extent that the reaction by energy ‘users’ like GM is similar to the SPX in 1990 while the skyrocketing Brent/CRB Index ratio is a dead ringer for 1990’s crude oil/CRB Index ratio our sense is that a reasonable case can be made for an end to the energy price push as we move into the month of April.
Equity/Bond Markets
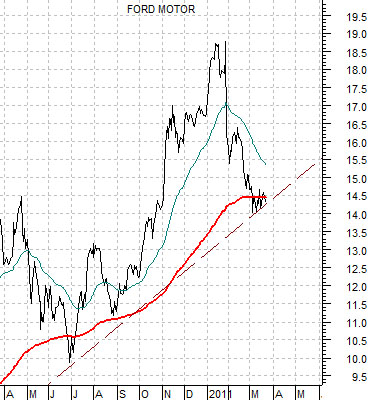
We have included once again a chart of Ford (F) directly below. The argument made yesterday was that Ford declined below its 200-day e.m.a. line at the end of June last year as the Eurozone crisis came to an end. With Ford currently holding the rising support line that has gone with the broad recovery from the March 2009 lows… and with the stock trading just below its 200-day e.m.a. line… a case can be made that we are nearing the end of a one-quarter correction. Put another way… if Iraq invaded Kuwait in 1990 and setting fire to its oil fields only led to a 3-month dislocation of prices in the markets (oil up, stocks down) then does it make sense to believe that the current situation in Libya is any more dire? Time will tell.
We are going to swing to some rather serious ‘macro’ thoughts now.
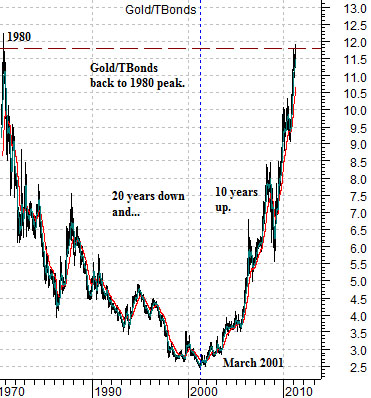
At top right is a chart of the ratio between gold futures prices and the U.S. 30-year T-Bond futures from 1980 to the present time period.
In 1980 the price of gold spiked to a top around 12 times the price of the TBond. The ratio spent the next 20 years declining until a cycle bottom was reached in March of 2001. From there it was go, go, go for gold relative to bonds until the ratio rose back to very close to 12: this year.
Twenty years down and ten years up.
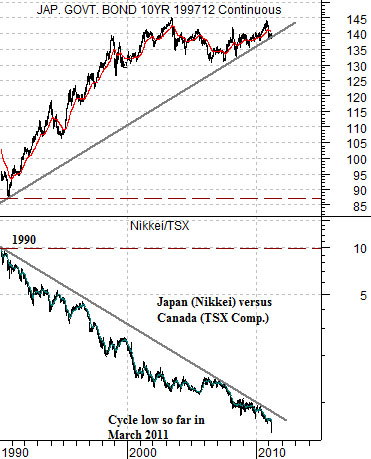
Below right is a chart of the ratio between Japan’s Nikkei 225 Index and Canada’s TSX Composite Index along with a chart of Japanese 10-year bond futures.
The Nikkei/TSX ratio peaked in 1990 and spiked to a cycle bottom in March of 2011. In other words… it is exactly 10 years ‘behind’ the gold/TBond ratio. The question we were pondering today was what would have to happen over the next decade in terms of commodity price trends, technical innovation, interest rate trends, etc. to swing the Nikkei/TSX ratio up from significantly less than 1:1 back to 10:1?