The markets are basically working through what appears to be a quarterly trend- a trend that began at the start of a quarter and will likely end or change once the new quarter begins. The trend involves rising bond and gold prices with downward pressure on the equity markets.
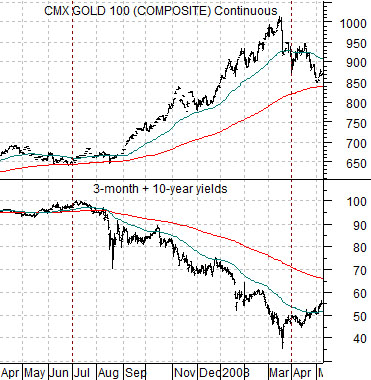
At top right is a chart comparison between gold futures and the sum of 3-month and 10-year U.S. Treasury yields from the spring of 2007 the spring of 2008.
We could probably argue that 2008’s markets debacle dated back to the start of a negative trend in early 2006 but that really wouldn’t be our point. The real action began around the middle of 2007 as the impact of previous weakness in the real estate sector finally began to show up in the banking stocks.
The chart shows that everything was just fine at the end of June in 2007 but once the calendar turned to mark the start of a new quarter interest rates began to fall as gold prices moved upwards. For three quarters in a row the trend was relentless as gold prices spiked up to the 1000 level in the face of falling short and long-term Treasury yields.
Is today similar to 2007 or 2008? From a certain perspective it would appear that the markets think so.
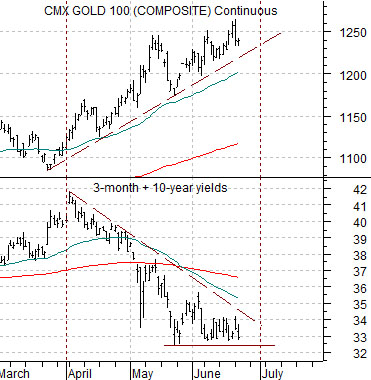
At bottom right we show the same comparison between yields and gold futures prices from March of this year through trading yesterday.
The argument is that the trend through the second quarter of this year is almost identical in a number of respects to the start of the 2007- 2008 bear market. Yields have been falling and gold prices have been rising with very little in the way of offsetting strength in the more defensive sectors within the equity markets.
Our view is that this is one-quarter trend. Our concern, for obvious reasons, is that this stretches on for another quarter or three. Our thought is that as long as yields are not making new lows and gold prices are not making new highs it makes sense to view equity markets weakness into late June as a bit of a gift instead of a final chance to get out before the next tidal wave of selling hits.
Equity/Bond Markets
he 2-year lag argument suggests that major trend changes in the direction of interest rates impacts the cyclical markets about two years later. In other words it takes a couple of years for monetary policy to work through the system.
U.S. interest rates began to decline in 2007 and we have argued that this helped support the equity markets through 2009. The problem was that European and Japanese short-term interest rates did not begin to decline until the second half of 2008.
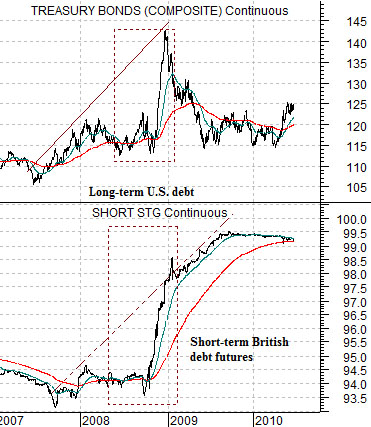
The chart at right compares the U.S. 30-year T-Bond futures and 3-month Short Sterling futures (British 3-month debt futures).
Notice the long-term U.S. bond prices began to rise in 2007 while short-term British bond prices held near the lows until the autumn of 2008. The 2-year lag suggests that the bond market’s strength through the final quarter of 2008 should show up later this year as a very positive cyclical trend. To the extent that the markets having been selling off based on the fears of a second half cyclical slow down we still feel inclined to tilt towards the bullish side of the equity markets into 2011.
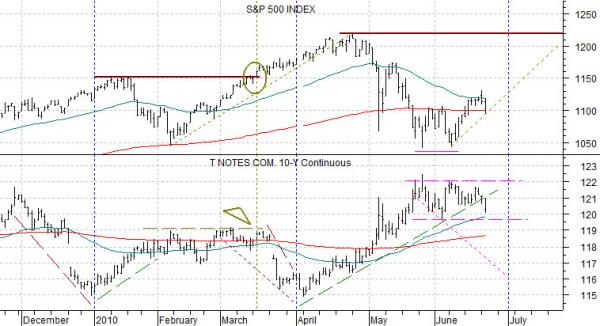
Below is a comparison between the S&P 500 Index and the U.S. 10-year T-Note futures.
We argued a number of weeks back that when the SPX bottomed the bond market would likely flatten out. If history were to repeat (i.e. a similar outcome to this past February and March) the SPX would have to rise to new highs above 1220 before the bond market would truly begin to weaken.
Obviously our view would be at risk if the 10-year T-Note futures punched up beyond the May peak around 122.