The markets have an intriguing tendency to do the ‘same thing’ over and over again but usually with a different cast of characters. Over the past few years, for example, the energy sector has been strong through the first half of the year even as the beneficiaries of the positive trend have changed.
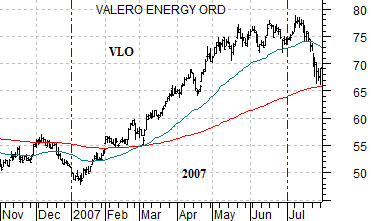
At top right we show a chart of oil refiner Valero (VLO) from 2007. The strong energy price trend in 2007 was dominated by a perception that gasoline inventories were too low which led to price appreciation for the refiners. The uranium stocks were also very strong.
At middle right we show Arch Coal (ACI) from 2008. The energy theme focused on the natural gas and coal stocks last year leading to a price peak for ACI in June.
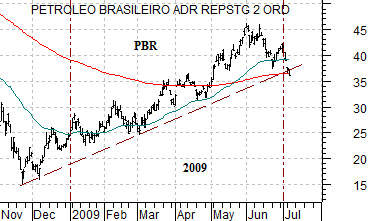
Below right we feature a chart of Petrobras (PBR). The energy theme this year was more a function of a rebound in Chinese and Brazilian growth following peaks for the long end of the U.S. Treasury market and dollar.
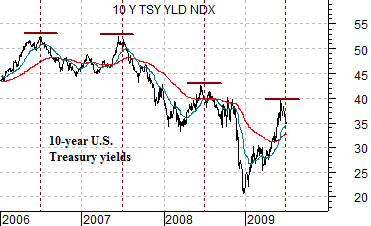
The point, however, is that even though the focus of the positive energy trend varied from year to year the relationship with the bond market remained consistent. The peak for 10-year U.S. Treasury yields was made in middle of 2006, 2007, and 2008 marking the end the commodity price push. While we expect energy and metals prices to be lower into the late autumn the ‘stop’ on this view would be a 4% 10-year Treasury yield. If yields were to break to new highs then the pattern will have been broken.
Equity/Bond Markets
he markets never fail to find new and unusual ways to vex us. To explain we return to a chart-based argument that we have shown in these pages on many occasions over the past year or so.
The argument was that the peak for the ratio between the Amex Oil Index (XOI) and S&P 500 Index (SPX) would mark the bottom for the equity market and the start of a sustained rising trend for a number of non-energy sectors.
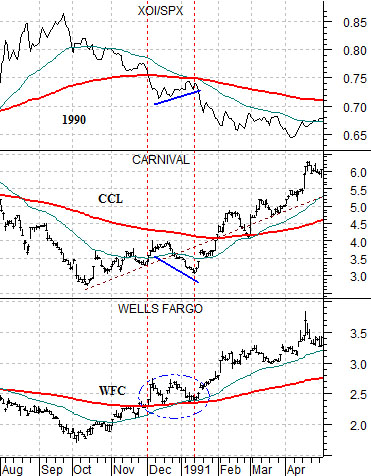
The chart at right compares the XOI/SPX ratio and the share prices of Carnival Cruise Lines (CCL) and Wells Fargo (WFC) from 1990- 91.
The peak for the oils on a relative basis was reached in late September of 1990 a few weeks ahead of the October bear market bottom. As crude oil prices peaked in advance of the Gulf War the bond market bottomed and turned upwards. In short order the stock market was on the rise even though the actual economic recession would not begin until early 1991.
We suggested that a decline by the XOI/SPX ratio to its 200-day e.m.a. line should go with an offsetting rise in the share prices of WFC and CCL up to their moving average lines. We also argued on a few occasions that if the XOI/SPX ratio were to break below its moving average line and then track back up to it- as was the case between December of 1990 and January of 1991- that the share prices of WFC and CCL would appear to be faltering. Once the XOI/SPX ratio resumed its downward march the pressure would ease and we would see these two stocks swing back up to their original rising trend.
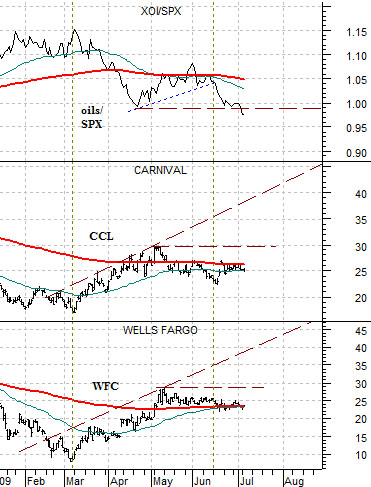
Below right we have included the same comparison for the current time period.
Notice that the peak for the XOI/SPX ratio was reached in early March which coincided with the low point for the S&P 500 Index. So far, so good.
The ratio declined to its moving average line in April as both CCL and WFC pushed upwards. By the end of April the oils began to strengthen which slowly moved the ratio back up to its moving average line as CCL and WFC retreated down from the early May highs. Once again… so far, so good.
So… on the one hand the chart-based argument has worked perfectly. On the other hand… we are having trouble rationalizing the recent break to new lows for the XOI/SPX ratio with our view that the equity markets will remain under pressure into August. In other words for all intents and purposes the break to new lows for the XOI/SPX ratio should be a very positive event even though it has taken place during a time period when the stock market is actually grinding lower.
Our thought is that this is probably a good time and an excellent place for us not to question our own argument. As long as the XOI/SPX ratio is declining or is holding below 1:1 then upward pressure should be building for the financials and non-commodity cyclicals. If WFC and CCL were to push to new recovery highs this month then we would expect the rallies to carry prices back up to the rising trend lines established in March and if broad stock market weakness this month keeps the share prices flat to lower… then the eventual recovery will simply be compressed into a shorter period of time.