We changed our first page chart presentation three times before finally settling on the comparison below. Whether this proves to be a good choice is open for debate.
The markets don’t always have to make sense but when there are too many cross currents it adds an extra layer to difficulty to our work. As usual it is the energy sector that we are struggling with.
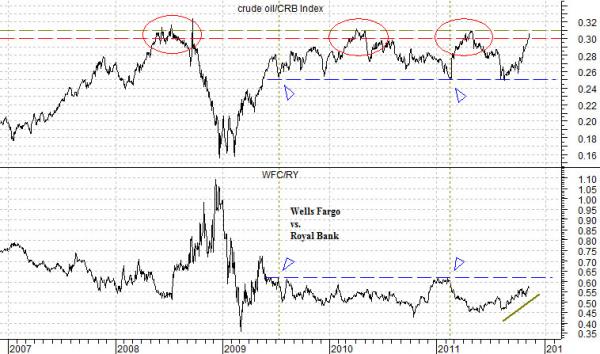
Below is a chart of the ratio between crude oil and the CRB Index along with the ratio between Wells Fargo (WFC) and Canada’s Royal Bank (RY).
The argument is that since Canada is a net energy exporter while the U.S. is a net importer a strong and rising trend for crude oil prices will serve as a positive for Canada and a negative for the U.S. If we reduce this to the relative strength between U.S. and Canadian bank shares we would expect to see Wells Fargo underperforming Royal Bank when the crude oil/CRB Index is rising and outperforming when the ratio is declining. So far… so good.
The first detail that pops out from the crude oil/CRB Index ratio is the way it has tended to reach an upper extreme once it crosses above .30. The ratio made a top in mid-2008 just above .30, a second top in 2010 between .30 and .31, and a third top earlier this year at the same level. While this time may prove to be different the evidence suggests that when the ratio between crude oil and the CRB Index rises to more than .30 there is a reasonable chance that oil prices are near a peak.
Now… the CRB Index traded yesterday between 317 and 320 so a price for crude oil above 95- 96 pushes it through .30.
The second detail that we noted was the recent rise in the ratio between Wells Fargo and Royal Bank. The ratio appears to be working back to the .6 level which, since 2009, has been associated with a crude oil/CRB Index ratio closer to .25. Given the current level of the CRB Index this suggests that something closer to 80 instead of north of 95 might be a bit more appropriate.
Equity/Bond Markets
Even though we read quite often that crude oil futures are rising because U.S. inventories are declining, Europe is stabilizing, or U.S. employment is improving… the driver at present is the flattening of the ratios between gasoline and crude oil as well as Brent and crude oil. The chart below shows the gasoline (RBOB)/crude oil ratio which has literally collapsed over the past month.
So… we are not sure how many hands we would need to list off the cross currents impacting energy prices but we will show two perspectives today.
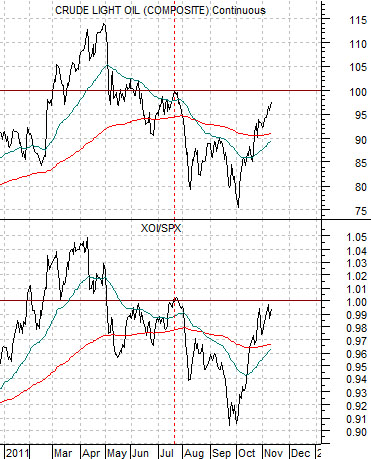
On the one hand the equity markets are pushing oil prices higher. We have argued that the equity markets ‘lead’ and than when the Amex Oil Index (XOI) rises above the level of the S&P 500 Index (SPX) so that the XOI/SPX ratio moves above 1.00 the price of crude oil tends to be at or above 100.
The chart below shows that the XOI/SPX ratio was just above 1.00 back in July when crude oil nipped up to 100 and is now threatening to once again move above 1.00. This is pushing crude oil steadily back towards triple-digits.
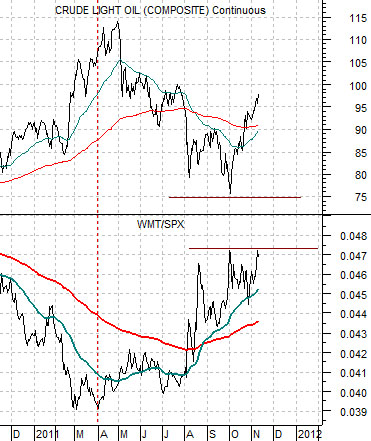
On the other hand the markets have an internal ‘defensive’ trend that tends to go with weaker Asian growth and lower oil prices. We use the ratio between Wal Mart and the S&P 500 Index (WMT/SPX) as a proxy for a defensive trend.
The WMT/SPX ratio has been trending higher since the end of the first quarter this year. As we have mentioned on a few occasions in recent days the longer this ratio keeps making new highs the more likely it is that crude oil is actually in a negative trend. We noted that oil prices defied gravity by rising for 9 months between the autumn of 2007 and mid-2008 as the WMT/SPX ratio pushed upwards so a case could be made for stubbornly strong oil prices into the end of this year (followed by another price collapse).