Aug. 19 (Bloomberg) — U.S. stocks rose for a second day as energy shares climbed on a rebound in oil and Merck & Co. led drugmakers higher after a judge upheld a patent, helping the market erase an early drop triggered by a slide in China shares.
The one thing that you can count on with regard to the markets is that it is never easy.
We tend to believe that the markets repeat past trends and cycles but always in a manner that is just enough different to hide the similarities. In other words while investors are attempting to relive past glories in previously hot sectors new themes rise phoenix-like from the ashes. It usually takes months- if not years- before a new trend becomes broadly recognized.
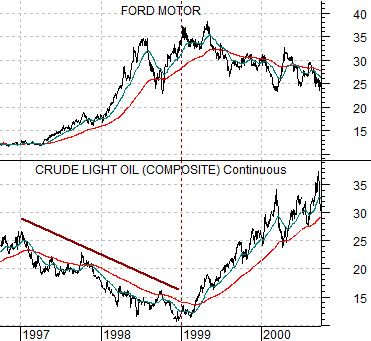
Our intention today is to make a positive case for the pharma theme. We are going to attempt to do this through a comparison to crude oil prices between 1997 and 2000.
The chart below compares the share price of Ford (F)- representing the cyclical energy-using theme that screamed higher between 1997 and 1999- and crude oil futures. The argument is that the two-year bear market for commodity prices that went with slowing Asian growth which, in turn, culminated in a crisis in late 1998 and early 1999 was offset by a very positive trend for the consumer, pharma, and energy-using themes. The peak for Ford’s share price was reached in 1999 leading into a bear market that extended through into the end of last year.
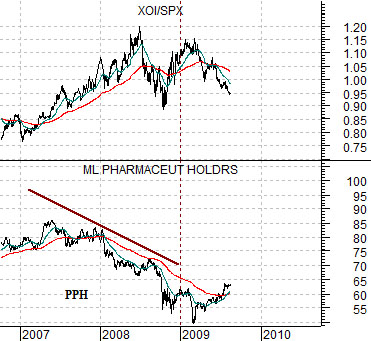
The chart-based argument is that the pharma sector’s two-year bear market during 2007 and 2008 was similar to the down trend for oil ten years earlier. Similar in a kind of ‘exactly the opposite’ manner.
The down trend in the pharma etf (PPH) was offset by extreme price strength in the Asian equity markets and relentless relative strength by the major oil stocks (Amex Oil Index (XOI) divided by the S&P 500 Index (SPX). Just as the peak for the share price of Ford in early 1999 marked the bottom for energy prices and the start of a new commodity bull market the top for the XOI/SPX ratio is helping to push money in a variety of new directions. The pharma etf (PPH) represents a sector that was essentially ‘left for dead’ by the markets from 2001 into 2008 but, from a purely subjective and somewhat biased point of view, seems to be doing more advancing and less retreating than it has for some time.
Equity/Bond Markets
Around the start of this year we wrote quite often that declining bond prices indicated the cyclical growth was improving. One can argue that there is a difference between stronger economic growth and an easing off of an ‘end of the world’ psychology but, either way, the point remains valid. When long-term Treasury prices begin to decline it typically means that economic growth is starting to firm up. And vice versa.
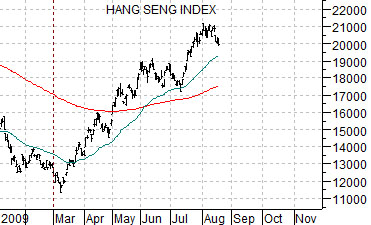
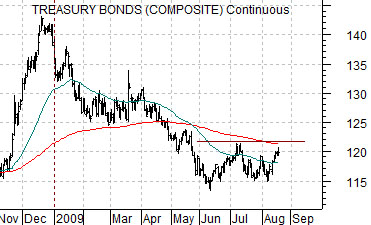
The ‘vice versa’ comment is our initial point today. At right we compare the Hang Seng Index with U.S. 30-year T-Bond futures. The charts have been shifted or offset by 2 months so that the falling bond prices in January line up with rising equity prices in March.
The thought is that one can explain the recent shakiness of the Asian stock markets by using a 2-month lag with the bond market. In other words the Hang Seng did not turn higher until two months after bond prices began to decline so- in theory- once bond prices turn higher the Hang Seng would continue to rise for roughly 2 months and then turn back to the down side.
The problem is… while the TBonds bottomed in early June (which fits perfectly with the early August peak for Asian share prices)… it is still not clear that the bond market has turned higher. It is trading well above the June lows even though it remains underneath the 200-day exponential moving average (e.m.a.) line.
We usually get ourselves into trouble when we try to be too precise with regard to loose relationships so we are probably better off using broad strokes instead of finely-detailed observations. The argument is that falling bond prices at the start of the year indicated that growth was improving and this, in turn, led to a rising stock and commodities markets.
As long as bond prices are trending lower nothing much has changed which, we trust, is somewhat obvious. If, on the other hand, the bond market bottomed back in June and confirms this by pushing the TBond futures back above the 121- 122 range then the downward pressure on the Asian equity markets makes sense simply because rising bond prices usually mean that growth has started to slow.
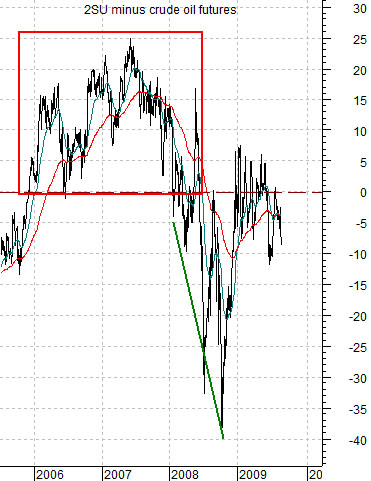
We have been focusing on the share price of Suncor (SU) in the back pages recently. The idea came from the observation that SU’s share price was very close to one half of crude oil prices over the past few years and peaked in mid-2008 at exactly one half of the eventual top for crude oil prices. Given that it topped out this year at 37 followed a month or so later by crude oil futures reaching 74… we argued that it was our contention that 74 was going to serve as the rally top for crude oil.
Below we show a chart of the spread between two times the share price of SU and crude oil futures. The point is that during 2006 and 2007 as oil prices pushed upwards the share price of SU was always ‘ahead’ of crude oil. In other words the spread was consistently greater than ‘0’ with two times SU exceeding the price of crude oil. Our thought was that as long as the spread was above ‘0’ the equity markets were saying that oil prices had further to go to the upside. Similar to last year, however, the spread has fallen well below the ‘0’ line and on days like yesterday when crude oil futures spike 3 points higher… the spread responds by getting progressively more negative.