The basic point that we were trying to make in yesterday’s issue is that following a strong equity markets rally from December into March the trend is currently under a certain amount of pressure. Our expectation is that this will lead to a few more forays lower by the S&P 500 Index towards the 1375- 80 region but in due course the correction will end leading into another 3 month period of price strength.
Quite often we have a ‘picture’ in mind of how the various markets are trending against each other. On a daily basis the action can appear almost random but if one steps back far enough in search of perspective things become a bit more clear.
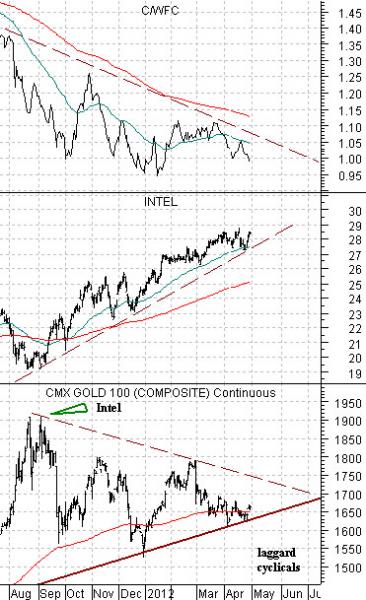
Below is a comparison anchored at the bottom by gold futures. From there we step up to a chart of Intel (INTC) before progressing to the top chart of the ratio between Citigroup (C) and Wells Fargo (WFC).
For good or for bad this is our ‘picture’.
Gold prices are still in a rising trend with fairly major support cutting through in the 1630- 40 region. As long as gold prices continue to hold at or near the 200-day e.m.a. line the trend for gold will remain positive. Fair enough.
Within the longer-term rising trend for gold there is a bearish trend. From the peak set in August of last year to the present day the price of gold has been working lower. Once again… fair enough.
The offset to the bearish trend for gold that carried prices down from around 1900 to the support line is the bullish trend for Intel. And Amgen. And quite a few other large cap equities with reasonable growth and quality profiles that are not involved in the production of commodities.
The offset to the long-term rising trend for gold is what we call the ‘laggard cyclicals’. To represent this theme we use the ratio between Citigroup and Wells Fargo. This ratio is not expected to turn higher until the price of gold is ready to turn lower by breaking down through the support line.
The point is that as long as gold prices are trending lower the trend for the theme represented by Intel should remain higher. The next step in the process should include a break of support by gold which will broaden out the recovery rally by adding price strength and momentum to the ‘laggard cyclicals’.
Equity/Bond Markets
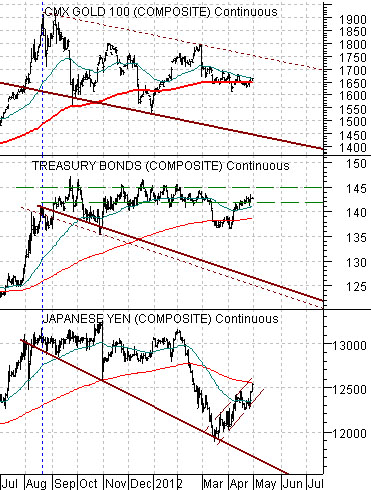
Next below is a comparison between the Japanese yen futures, the U.S. 30-year T-Bond futures, and gold futures.
The premise is that all three markets are following the same broad trend. This does not mean that they will move higher and lower at the same time but the direction of the trends should be similar along with the key turning points.
When gold prices reached a peak in August of last year the trend for the bond market and Japanese yen became bearish. Of course the Japanese yen did its best to disguise this fact as it held near the highs through the month of January this year but the chart shows that each subsequent decline was to lower prices.
To put things into perspective let’s look first at the gold futures chart. Notice that gold is doing little more at present than chopping back and forth around the 200-day e.m.a. line. This is fairly typical of a market that really doesn’t have a strong sense of its own direction. Gold prices are really bearish but, then again, they also aren’t bullish.
The Japanese yen futures are on ‘the bounce’ and, to a large extent, this is the problem facing the equity markets. With the yen trending higher the TBond futures are grinding back up towards the old trading range between 142 and 145.
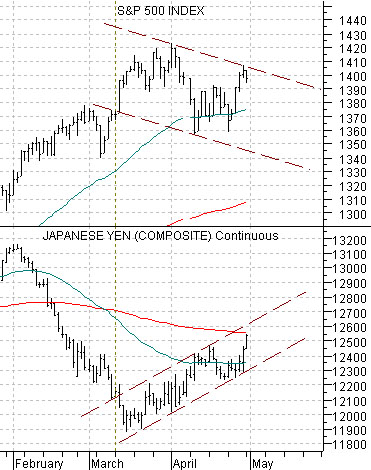
Below is our comparison between the S&P 500 Index (SPX) and the Japanese yen futures.
The argument is that the equity markets shifted from bullish or positive over to bearish or negative when the Japanese yen futures turned upwards in mid-March. This is the picture that one should keep in mind with respect to the trend for equity prices.
When the yen rises the downward pressure on the bond market disappears which leads to the TBonds floating back up into the old trading range. This reflects the ‘hope’ by investors that U.S. economic growth is tepid enough to hold the Fed funds rate near 0% for a considerable length of time.
So… there are two time frames to pay attention to. The first is, more or less, the ‘here and now’. In this time frame the Japanese yen and bond market are slowing grinding back to the upside. The offset to this is downward pressure on the S&P 500 Index.
The next time frame is ‘what happens next’ and the problem with this is that it may begin today, next week, or a few months from now.
Our view is that the yen is simply bouncing back up to its 200-day e.m.a. line but, as these things tend to go, it will probably remain reasonable strong into mid-month. This means that the equity markets will also remain under pressure as investors heed the ‘sell in May and go away’ adage.
As to what happens next… we would look for the yen and bond market to weaken, gold prices to break the rising support line, and a surprisingly robust equity markets trend led by equally surprising strength in the laggard cyclicals.