Our bottom line once again is that the cyclical trend will remain positive through the end of this year. Given that the month, quarter, and year are rapidly drawing to a close our focus is shifting somewhat from offense to defense as we attempt to skry into the future.
In a sense this is still a two-handed market. On the one hand the Fed is actively attempting to stimulate the U.S. economy to pick up the slack created by the output gap. On the other hand the other major player- China- is working to slow growth and control prices. With two economic juggernauts working a cross purposes… our work becomes all the more challenging.
Earlier this week Amgen’s share price popped upwards on ‘news’ only to give a portion of the gains back in trading yesterday. Our purpose today is not to argue that Amgen’s share price is going to rise but rather to show what a sustained improvement in relative strength will presage. Put another way… if Amgen’s share price keeps rising it may be conveying a message that we should be paying attention to.
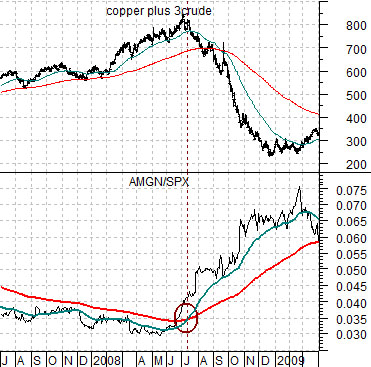
We are going to return to a chart that we included in yesterday’s issue. Below is a comparison between the sum of copper and crude oil futures (copper in cents plus 3 times crude oil in dollars) and the ratio between Amgen (AMGN) and the S&P 500 Index (SPX).
The AMGN/SPX ratio represents Amgen’s ‘relative strength’. When the ratio is falling it has meant in recent years that money is pushing towards the kind of themes that have gone with stronger Asian and emerging markets growth. On the other hand when the ratio is rising it generally means that the dollar is starting to firm which, by extension, casts a pall on the upward trend for energy and base metals prices.
In any event… in May of 2008 the AMGN/SPX ratio bottomed and began to rise. By June the ratio crossed above its 200-day e.m.a. and by early July the trend was strong enough to cross the 50-day e.m.a. up through the 200-day. A few weeks later… the commodity markets collapsed.
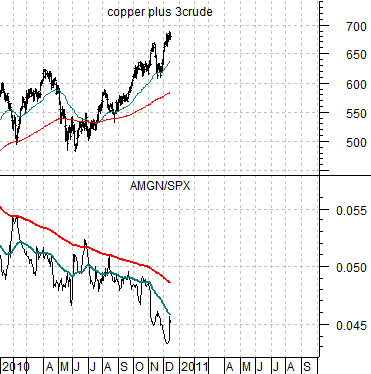
The chart further below shows the same comparison for the present time period. Notice that the ratio has made repeated forays up to the 200-day e.m.a. line in recent months only to slump lower as the music associated with the Asian/emerging markets growth themes continues to play. Rallies for this ratio are of little concern until… the ratio moves nicely above the moving average line. In terms of playing ‘defense’ we have to really start paying attention if the moving average lines threaten to cross some time early in 2011.
Equity/Bond Markets
We throw so much at the wall that we don’t resort to the usual ‘told you so’ kind of drivel that one tends to stumble over so often. Our intention is to avoid the bombastic self-congratulatory garbage that so many in this kind of business resort to. Yet… every now and then… we do get things right.
Our basic views over the past few months have been that the equity markets and cyclical growth would be stronger, the dollar would flatten out, and that bond prices would decline. With yields galloping higher, the S&P 500 Index close to new recovery highs, and the dollar holding in fairly well… we felt the urge to wallow in the muck somewhat. On the other hand one doesn’t have to look much farther than our long-standing antipathy towards golds prices to realize that the markets are truly humbling.
Anyway… we are going to show two different views pertaining to the bond market today.
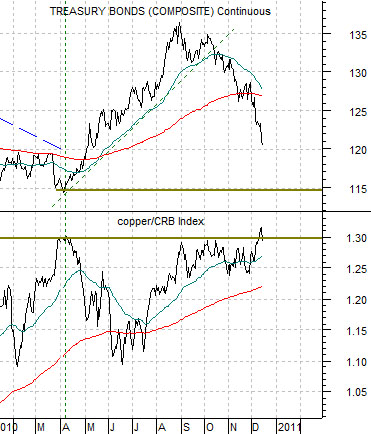
Immediately below is a chart of the U.S. 30-year T-Bond futures and the ratio between copper and the CRB Index.
Copper prices are very closely tied to yields. In fact copper prices tend to reflect the health and strength of Asian growth and will tend to move higher as volatility (VIX) declines.
The point is that the upward swing in the bond market (i.e. falling yields and rising prices) that began at the start of this year’s second quarter (April) had much to do with the peak set for the copper/CRB Index ratio.
When the copper/CRB Index ratio stopped rising the markets rotated out into a number of new themes. These included rising bond prices AND strength in grains prices. From the end of March through September the markets pushed bond and grains prices upwards. The trend shifted once again at the start of the fourth quarter as bond prices started to decline while grains prices flattened out.
The chart argues that as long as the copper/CRB Index ratio is making new recovery highs we will have to expect lower bond prices. The next key level of support for the TBond futures appears to be back around 115. In a perfect world the equity markets will remain positive until the TBonds resolve back to 115.
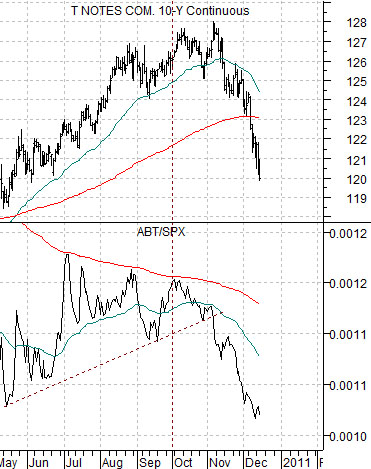
The chart below compares the U.S. 10-year T-Note futures with the ratio between Abbott Labs (ABT) and the S&P 500 Index (SPX).
The argument is that the ABT/SPX ratio represents the underlying trend for bond prices. The twist is that the bond market can diverge from this ratio for weeks or even months. Notice, for example, how the ratio turned clearly lower way back in August as the U.S. 30-year T-Bond futures (chart at top right) reached a peak but well in front of the final highs set by the 10-year T-Note futures in early November.
We included this chart today and in the back pages yesterday because… the ABT/SPX ratio started to rise. Obviously this could still be random noise but with trend changes occurring around quarter ends and the bond market in virtual free fall this was perhaps the first indication of a potential price bottom that we have seen in quite some time. We will keep an eye on this relationship through the coming weeks because the stronger it gets the more likely it will be that the bond market is approaching next price support.