The investors or traders who do best during any markets cycle are those who are on the right side of the trend and have the greatest level of conviction. In other words it doesn’t do much good being on the right side of the trend if you are constantly diving out each time prices start to correct.
Our point, we suppose, is that ‘conviction’ is a difficult thing to come by. We have long admired those with the kind of unshakable belief that keeps them in a market that has long since gone parabolic. We tend to be early with our entry points and equally early on the way out the door.
The previous decade’s trend involved a strong BRIC theme with equally strong commodity prices as interest rates were pushed higher. Eventually the rise in yields and energy costs put so much pressure on the financial system that we came very close to the end of civilization as we know it. With the BRIC theme and commodity prices once again driving the trend one has to wonder whether we are going to have to relive in some form or another the lessons of 2008.
The argument that we are attempting to make is that it is one thing to hold a positive or bullish point of view and another to do so blindly and without question. On a daily basis we question our views while searching for divergences and early warning signs. Today we wanted to go over two of the charts that we have been following along the way.
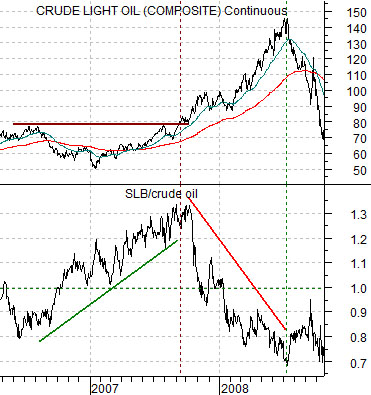
Below is a comparison between crude oil and the ratio between oil service company Schlumberger (SLB) and crude oil. In late 2007 SLB began to weaken relative to crude oil which was the equity market’s way of ‘saying’ that oil price strength was starting to become a negative. To date the SLB/crude oil ratio is still rising as the oil stocks outperform crude oil prices.
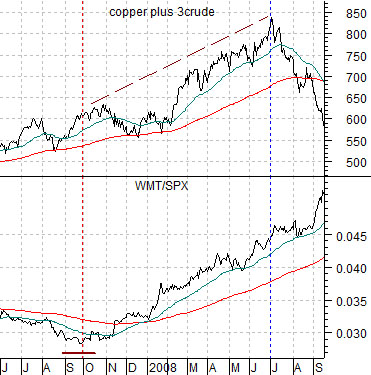
Next is a chart of the sum of copper and crude oil futures and the ratio between Wal Mart (WMT) and the S&P 500 Index (SPX) from mid-2007 into the autumn of 2008.
As the SLB/crude oil ratio began to decline the WMT/SPX started to rise. In response to rising energy prices money began to shift towards more defensive themes during the final quarter of 2007. We have included current views of both charts on page 7 to show that to date the markets haven’t reacted to commodity price strength in a manner that suggests an eventual or imminent problem.
Equity/Bond Markets
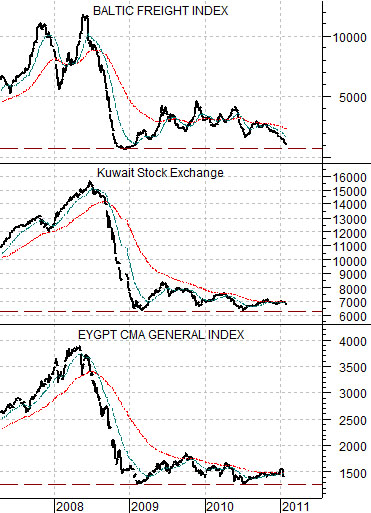
Below is a comparative view of the Baltic Dry Index, the Kuwait stock market, and Egypt’s stock market.
Now… one would think that the Kuwaiti market should be on fire these days as crude oil prices push towards triple-digits. Yet the chart shows that both Kuwait and Egypt have been languishing post-2008 along with bulk ocean freight charter rates.
This is kind of an interesting puzzle because it shows that money has been moving away from the Middle Eastern markets for some time and… we have argued that crises tend to occur in markets that have suffered from prolonged periods of capital outflows. In other words the argument would be that Egypt and Kuwait represent the kind of countries that could represent the source of the next round of problems.
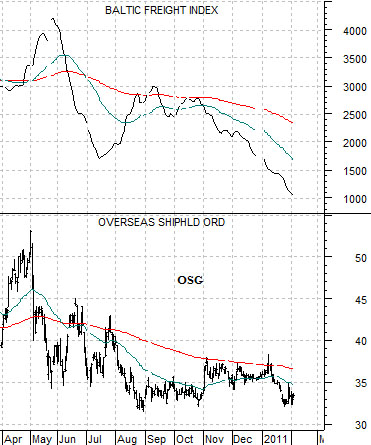
The next question might be why both are trending so closely to the Baltic Dry Index? We have no readily available answer for that. We have noted, however, an increase in the number of queries surrounding the ocean freight companies so we have included a chart of the Baltic Dry Index and bulk shipper Overseas Shipholding Group (OSG) below right.
The point is that over the long run it only makes sense to take positions in the shippers when freight rates start to improve. We will expand on this on the following page.
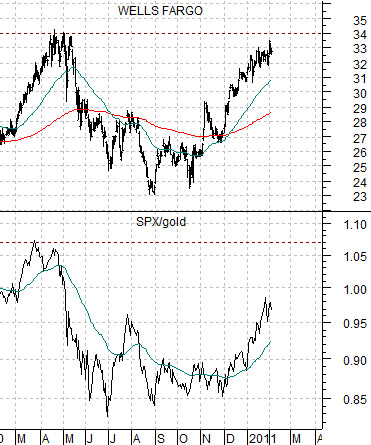
Quickly… one of our enduring arguments has been that there is an offset or inverse relationship between strength in gold and the health of the major banks. Below is a chart of Wells Fargo (WFC) and the ratio between the S&P 500 Index (SPX) and gold futures. The idea is that the better WFC does the higher the SPX/gold ratio should move so while gold prices can rally on any given day we have no reason to question our view as long as the banks keep grinding higher in price.