For as difficult as it is to believe there will come a time when the Fed will start to raise the funds rate. It won’t be this week of course but it may well be some time this year.
Most economists believe that the recession has left an output gap- especially in terms of employment- that will keep the funds rate close to 0% well into 2012. Our counter to this is that it isn’t the weakest market (employment) that is the issue but rather the strongest market.
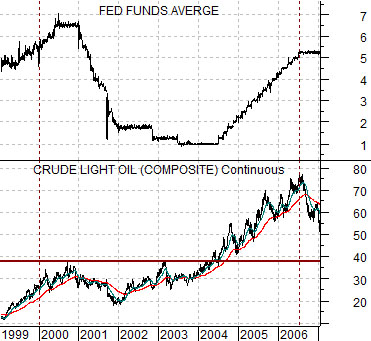
Below is a comparison from 1999 through 2006 showing the Fed funds rate and crude oil futures.
The argument is that the ‘strongest market’ during the most recent cycle involved energy prices. The funds rate declined from around 6.5% at the height of the Nasdaq’s party down to 1% in 2003 and remained at the lows until crude oil and heating oil futures prices finally drove to new all time highs in 2004. With energy prices pushing upwards the markets began to lift short-term interest rates until 3-month TBill yields moved above the overnight funds rate. When this happens the Fed will tend to raise the funds rate at the next meeting. Which, of course, it did in June of 2004.
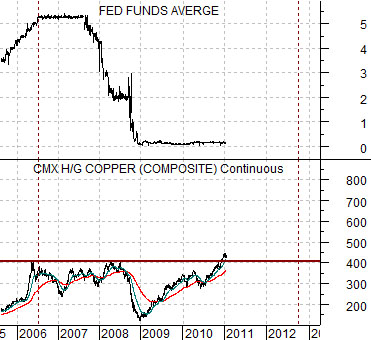
At bottom is a chart of copper futures and the Fed funds rate from the current time period.
One could argue we suppose that the Fed will hold rates close to 0% until the U.S. employment increases substantially or crude oil futures prices rise to new all time highs. This is definitely a potential outcome but… not one that we would really like to see come to pass.
We have set the charts up to make the case that copper prices may turn out to be this cycles ‘strongest market’. There was a definite change within the markets during the final quarter of 2010 when copper prices moved to new all time highs; long-term yields began to rise, the laggard banks came back to life, and there was even a small amount of weakness in consumer growth names such as McDonald’s (MCD). Our sense at the time was the copper prices above 4.00 may turn out to be somewhat similar to the break out by crude oil futures prices in 2004 with the Fed funds rate eventually rising through into the autumn of 2012 in response.
Equity/Bond Markets
As best as we can tell the markets shifted gears in a number of important ways between early November and early December last year. Chances are that we will look back on what happens over the next 12 to 24 months and argue that it should have been obvious but… it never is in real time.
In early November of last year the yield spreads peaked and turned lower. By ‘yield spreads’ we are referring to the spread between 30-year and 10-year Treasury yields and 30-year and 5-year Treasury yields. By early December copper futures broke to new all time highs.
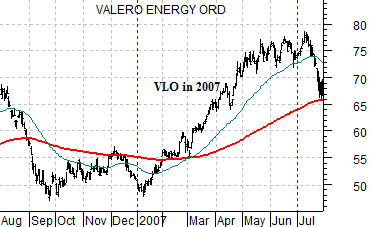
We mentioned a few weeks back that this is the time of year to watch for trend changes. In particular we were looking for stocks or markets that were trading below their respective 200-day e.m.a. lines before pivoting higher. This is often an indication of the start of something that will last for a quarter or two.
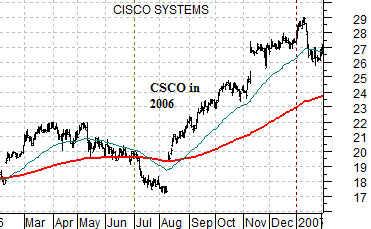
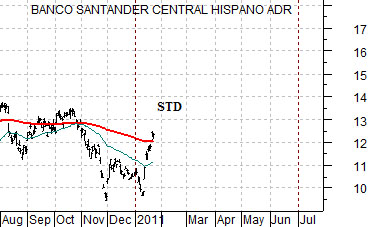
Below are charts of oil refiner Valero (VLO) from 2007 and Cisco (CSCO) from 2006. Below this we have added a chart of Banco Santander (STD) from the current time frame.
The ‘laggard banks’ came to life late last year as the yield spreads began to tighten in. The usual argument is that one buys ‘laggard cyclical’ names when the yield spread starts to decline and then holds them until the yield spread inverts. In terms of our thesis we could see the yield spread actually inverting some time towards the autumn of 2012.
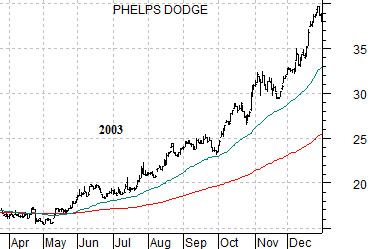
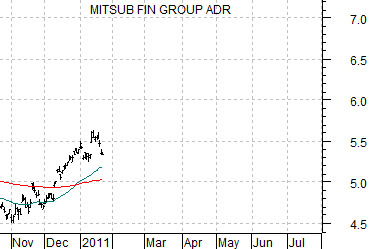
Below we have set up a completely artificial and self-serving comparison. We are doing this in response to the inquiries received over the past number of days regarding the tumble in the share price of Japanese bank Mitsubishi UFJ (MTU).
Last is a chart of MTU while below right we show a chart of Phelps Dodge from 2003. We are attempting to show that while PD may have represented one of the strongest and most theme-positive names in the market back in 2003… it didn’t rise in a straight line. It did, in fact, correct lower from time to time and often went a month or more without making new highs.
Our point is that even if MTU turns out to be a relative strength juggernaut into 2012 it will still sell off every few weeks. Best case would be that every correction holds at the rising 50-day e.m.a. line and that after a few quarters of grinding the trend starts to go a bit parabolic. Only time will tell of course.