Note: We are once again going to be AWOL for the first two weeks of December. As usual we fully expect to come back on December 12th to a host of queries about the abrupt end to our daily publication schedule so the answer is that every year around this time we take a week or two off in search of sun, sand, and perspective. After around 50 consecutive 6-day work weeks it is time for a brief pause. However… we do expect to send out an issue for Monday either late Friday or some time on Saturday. Best wishes and many thanks!
We have argued that cyclical is cyclical. By this we mean that most economically sensitive sectors trend higher and lower at the same time. In general the cyclical trend reflects the direction of long-term yields so rising interest rates tend to be a positive while falling rates are a negative.
From cycle to cycle and decade to decade the relative strength leadership within the cyclical sectors changes with much of this based on the direction of the U.S. dollar. A stronger dollar puts pressure on raw materials prices while a weaker dollar helps to push prices higher.
From the early 1990’s to the present day the Japanese stock market has only risen when yields are moving higher. The U.S. market shifted to a similar trend in 1998 around the time of the Asian crisis. In years past, however, some of the longest and most powerful equity bull markets have occurred during periods of cyclical weakness and falling interest rates.
Just below is a chart of copper futures from 1995 into 2004. Copper prices were very weak from 1995 into 1998’s Asian crisis and then again through into the final quarter of 2001. The S&P 500 Index responded with a bullish trend from 1995 into 1998 and a bearish trend during 2001.
Next is a chart of the ratio between Japanese bank Mitsubishi UFJ (MTU) and the gold etf (GLD). The combination of a laggard bank (MTU) divided by the destination for risk averse capital (gold) may or may not serve as an adequate comparison to copper from ten years previous but this is one of the ‘pictures’ that we keep coming back to.
The argument is ‘something’ is going to change as we push into 2012 that will favor Japan, the banks, the laggard banks in particular, while putting at least some amount of downward pressure on gold prices.


Equity/Bond Markets
We will deal quickly with the chart at right before returning to our page 1 argument.
Below we show the U.S. 30-year T-Bond futures and the Japanese yen futures. These are two markets that rise when the markets are in ‘crisis’ trading mode. We can cobble together all kinds of chart-based arguments but the most basic point would be that as long as the TBonds and yen are pushing higher we have to expect downward pressure on cyclical asset prices.
So… copper prices declined from 1995 into late 2001 before pivoting upwards seeming ‘out of the blue’ into a major bull market. From an intermarket point of view… what happened
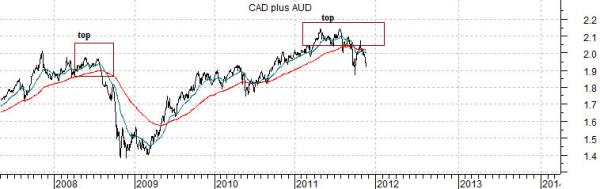
Aside from the fact that this was all about China’s economic growth the trend can be seen through the combination of the Canadian and Australian (CAD plus AUD) dollar futures.
The commodity currencies bottomed in 1998 ahead of the Asian crisis and then bottomed once again in 2001. The low points for the commodity currencies marked the low points for commodity prices.
The current situation is, in some respects, close to the exact opposite as the commodity currencies topped in 2008 ahead of the subprime crisis and again- apparently- in 2011. Instead of the start of a long-term commodity bull market the currencies are trading as if we are close to the start of what may be a long-term commodity bear market. If this proves to be true then the next growth cycle will come from those sectors and markets that ‘use’ instead of ‘produce’ raw materials.