We might have been inclined to fade the message from the Decade Trend if it hadn’t worked so nicely over the last few years. In early 2009, for example, we noted on a few occasions that if the Decade Trend was still in effect then we should expect to see a major recovery in cyclical asset prices. Into the first quarter of 2009 the idea of a rampaging stock market recovery seemed somewhat unlikely but… so far, so good.
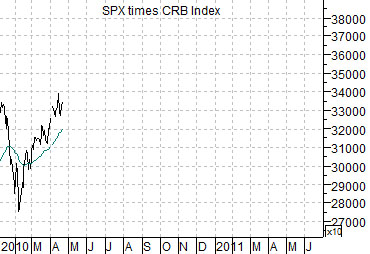
The Decade Trend argues that following a period of crisis in the ‘7’ and ‘8’ years the ‘9’ year will feature a strong asset price rebound that will set a peak in the ‘0’ year leading into a correction through the ‘2’ year. In other words… if history were to repeat… we would expect to see equities and commodities stronger early in 2010 and then weaker as the year draws to a conclusion.
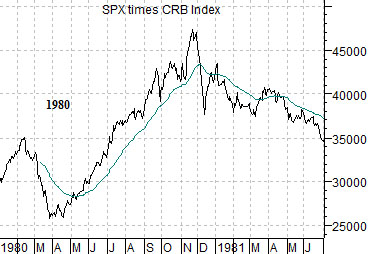
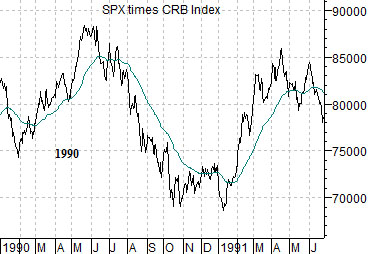
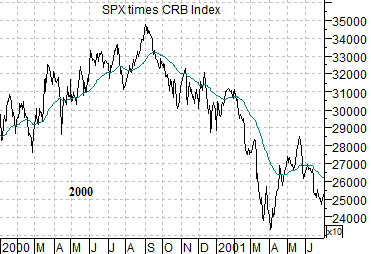
Below are three charts of the product of equities (S&P 500 Index) times commodities (CRB Index). The top chart is from 1980- 81, the middle chart from 1990- 91, and the lower chart is from 2000- 2001.
The point that we are attempting to make is that in all three cases one or more markets reached a major cycle top. In 1980 it was commodities, in 1990 the Japanese stock market peaked, and in 2000 the Nasdaq reached a high. Yet… there wasn’t any one particular point in time where the trend pivoted back to the down side. In 1980 asset prices remained stronger into November, the 1990 bear market began around the start of the third quarter, while the 2000- 2002 bear market gained traction as we shifted into the fourth quarter. For now the trend is definitely positive but there should come a point in time later this year when it will make sense to head for the sidelines as quickly as possible.
At the start of this year we mentioned that we expected equities to start the year of on a positive note and then end the year badly. If this proves to be true then the challenge that we are dealing with has to do with… when. When will the positive equity market trend turn into a negative trend?
Our initial premise is that a strong cyclical trend early in 2010 will turn into a negative trend later in the year that will extend through into late 2012.
Our next premise is that trends change when they make the least amount of sense. Bull markets begin when it appears that growth will never improve while bear markets begin when the news appears to be overwhelmingly positive.
The third premise has to do with the bond market. We tend to believe that the one market that you should never argue with is the bond market. When yields start to decline it means that growth is slowing. When yields trend higher it means that growth is improving. The less sense the bond market makes… the more likely it is that something important is happening.
There are two potentially bearish outcomes that we have to watch out for. The first is based on a collapse of growth and falling interest rates while the second is a function of a sharp rise in yields similar to pre-crash 1987.
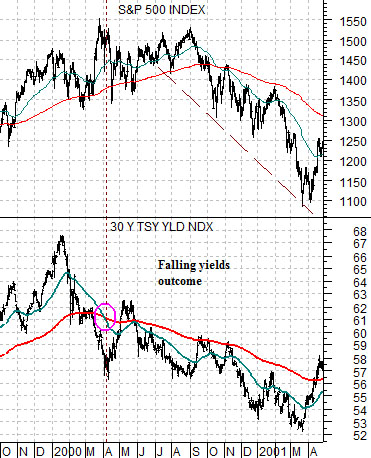
Below is a chart comparison between the S&P 500 Index (SPX) and 30-year Treasury yields. We are using 30-year yields today because the long end of the Treasury market tends to lead the short end.
The chart shows the time period between the autumn of 1999 and the spring of 2001. The argument is that months ahead of the peak for both the Nasdaq and the S&P 500 Index yields began to decline. Not only did 30-year yields track lower but they fell far enough to ‘cross’ the 50-day e.m.a. line down through the 200-day.
Our argument is that if the recovery runs out of steam then this should show up through declining long-term yields. So far that has not happened.
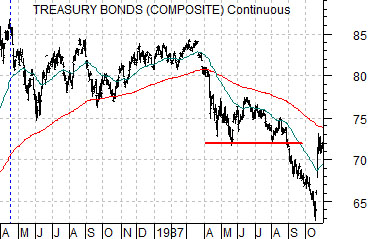
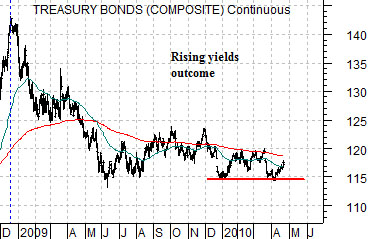
The second outcome that we have recently been fixating over has to with rising instead of falling yields. At right are two charts of the U.S. 30-year T-Bond futures. The top chart runs from the bond market’s price peak in April of 1986 through into the stock market ‘crash’ in October of 1987. The lower chart runs from the bond market’s price peak in December of 2008 to the present day.
If lower yields mean that growth is slowing then higher yields suggest that growth is accelerating. In most cases markets react positively to any cyclical trend that is strong enough to push interest rates higher.
Our thought is that if the financial markets get too far ahead of the real economy then it is possible that we could see something similar to the 1987 stock market ‘crash’ later this year. The key is that 30-year T-Bond futures PRICES have to break below support at the 114 level. Our expectation, by the way, is that this is going to happen. Whether it leads to a stock market event is another issue.