The decline in the equity markets has taken out one support level after another so attempting to pick a bottom is almost pointless. Our view is that we are the midst of a ‘crisis market’ that is working very hard to bring relative prices back into line. This process pushes some prices higher while pulling other prices lower.
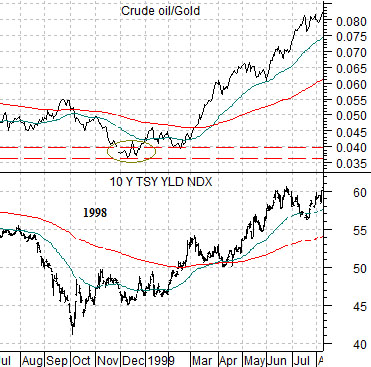
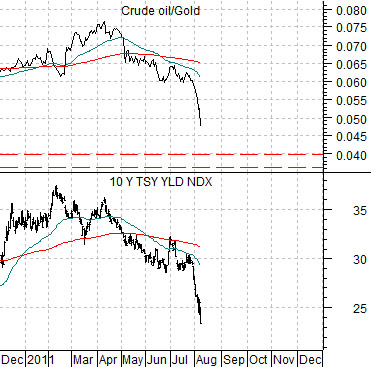
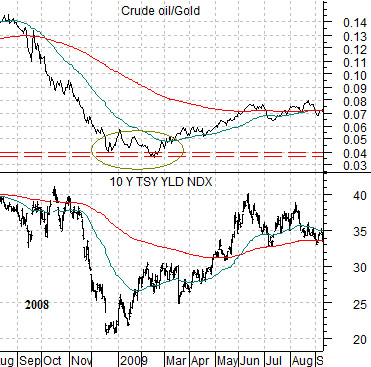
We have included three charts of the ratio between crude oil and gold futures along with 10-year Treasury yields. We are arguing that the crude oil/gold ratio is headed back to .04 which is also the same as the price of gold rising to 25 times the price of crude oil.
Through the Asian/Russian/LTCM/Brazil crises of 1998- 99 the yield on 10-year Treasuries tumbled as the crude oil/gold ratio declined below .04. The same outcome occurred at the end of 2008 to mark the low point for yields.
Upward pressure on gold and downward pressure on oil prices is pulling the ratio rapidly lower but it still somewhat ‘too high’. After yesterday’s debacle we are closer to a bottom for yields.
Equity/Bond Markets
As the price of gold struggles to lift to 25 times the price of crude oil the bond market continues to rise as equity prices decline. The ratio between the S&P 500 Index (SPX) and U.S. 30-year T-Bond futures is moving rapidly lower.
One of the key features of crashes and crises is an abrupt decline in the SPX/TBond ratio. The tendency is for this ratio to snap back to its last area of major support. The good news is that we are farther along in the process while the bad news is… that this might take a bit longer.
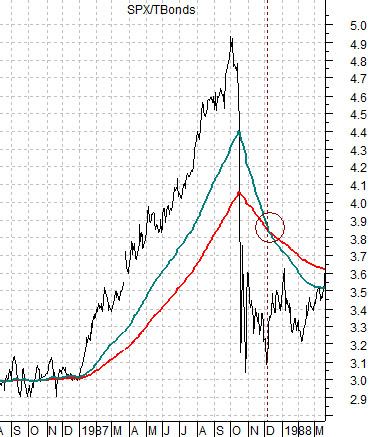
At top right is a chart of the SPX/TBond ratio from 1987. Notice how the ratio drove higher with commodity prices through 1987 before snapping all the way back down to levels close to those from 1986. The ratio bottomed around the time that the moving average lines ‘crossed’ in December of 1987.
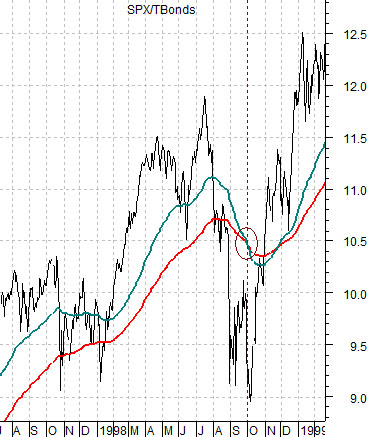
Below right is the same ratio from 1998. The late-summer crisis trend pulled the ratio back to the levels of one year previous with the ratio making a bottom around the time that the moving average lines ‘crossed’ to the down side.
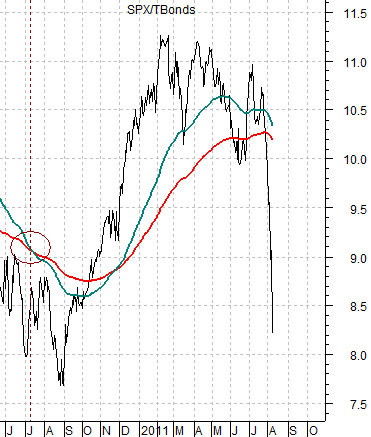
If we use the same template for the current market then the SPX/TBond ratio would be expected to decline back to the levels of August of last year with a low point reached around the time that the 50-day e.m.a. line moved down through the 200-day e.m.a. line.
The good news is that something close to 8:1 might well be enough to set a bottom. The bad news is that it might take a bit longer before the moving average lines converge.