The markets continue to work through a weaker cyclical trend emanating in large part from a slow down in Asian growth. This correction is resulting in a reversal in the flow of money which, in turn, impacts a variety of markets.
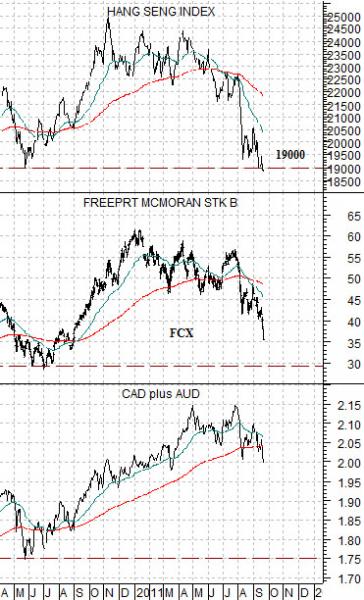
Below is a chart comparison between Hong Kong’s Hang Seng Index, the share price of copper miner FreePort McMoRan (FCX), and the sum of the Canadian and Australian (CAD plus AUD) dollar futures.
We continue to look for a stronger U.S. dollar as the combination of massive deficit financing and slower global growth draws money back towards this currency.
The chart makes the rather interesting point that the Hang Seng Index is leading the trend change as it pulls back to the lows set in May of last year. The share price of FCX is following along at a somewhat slower pace as it remains above support near 30.
The wild card here might be the commodity currencies.
When the U.S. dollar is stronger the Canadian dollar tends to do better than the Aussie dollar as money moves away from Asia and towards North America. Both the CAD and AUD are fairly close to parity with the U.S. dollar at present but to return to the lows set in May of 2010 the Australian dollar would have decline back towards .80 while the Cdn dollar would find support closer to .93.
The commodity currencies tend to trade with energy prices so the kind of decline suggested by the chart would also argue for something closer to 70 for crude oil.
In the spring of last year copper futures were trading below 3.00 while gold was holding between 1150 and 1250. In theory the longer the Hang Seng Index continues its downward trend the greater the pressures will be on commodity prices and the commodity cyclical sectors.
Equity/Bond Markets
We mentioned a few days ago that weaker copper prices did not necessarily mean that equity prices had to tumble. The intermarket argument is that weaker copper prices go with falling yields and a stronger U.S. dollar and this tends to create a rising trend for equities versus commodities.
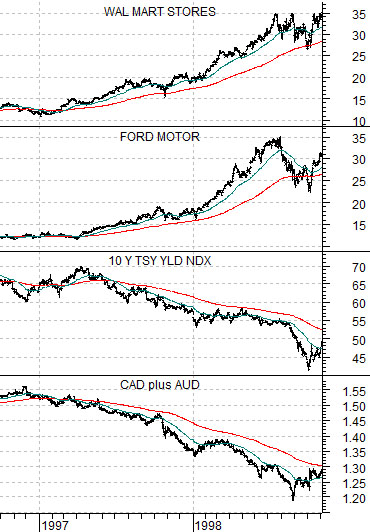
Quickly… below is a chart of Wal Mart, Ford, 10-year Treasury yields, and the sum of the Canadian and Australian dollar futures from 1996- 98.
In this instance weakness in the commodity currencies and interest rates went with a share price rise for both Ford and Wal Mart from around 12 up to 35. In other words it is possible for the equity markets to respond in a bullish manner to falling interest rates and commodity prices with the caveat that the bulk of the gains will come from the non-commodity sectors.
Now… for a bit of perspective. This is probably important.
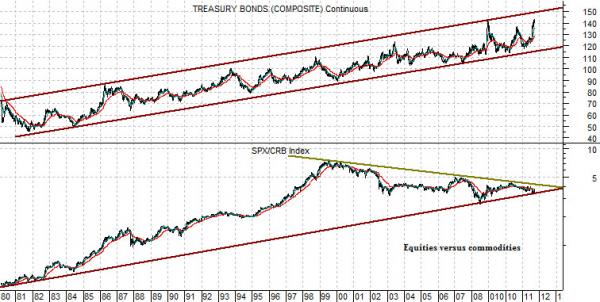
Next we show a rather long-term view of the U.S. 30-year T-Bond futures and the ratio between the S&P 500 Index and CRB Index.
The first point is that the trend for bond prices is still clearly higher. The second point is that when bond prices are trending higher the equity/commodity ratio rises. The third point is that the SPX/CRB Index ratio go so far ‘above trend’ into 1999- 2000 that it had to work back to the rising support line.
The support line drawn on the chart is, as always, somewhat arbitrary but the idea is that if we link the lows between 1980 and 1984 with the ratio bottom in 2008 we probably have a reasonable depiction of ‘support’. Today the ratio is sitting right back on support as the bond market continues to trend upwards. This suggests (to us) that the markets are ready to push equity prices higher relative to commodity prices and… when this happens… it tends to result in a better trend for most of the large cap U.S. sectors (pharma, consumer, tech) that have been weaker since the end of the 1990’s.