At times the markets seem to move so quickly that it is almost impossible to react while at other times trends grind on so slowly that one is lulled into a state of near paralysis. We tend to deal with the highs and lows of fear and greed by creating a variety of theses that form the foundation of our expectations. When the markets start to move fast we compare what is happening with what we believe should be happening and then either toss our theses out the door and start again or sit back, let the markets do their work, and enjoy the ride.
We continue to look forward to a time when the markets actually become simple and straightforward. We suspect that this may never happen but we do remain ever hopeful. Perhaps it is the advent of computer trading programs and black box systems that makes the markets jerk around so violently but the longer we do this job the more difficult and complex it seems to get.
Our opening ramble may well hide the fact that we are not quite sure what Friday’s trading was all about. It could reflect recent dollar strength which serves to slow the ascent of the commodity markets but it could also prove to be a conviction-testing correction in an ongoing trend. Do we dive out or dig in? Our thesis is and has been that the cyclical trend should remain robust through the end of the year although we can justify some amount of weakness in the Asian equity markets ahead of quarter end. For now we will stick with our thesis even as we check it and recheck it on a daily basis.
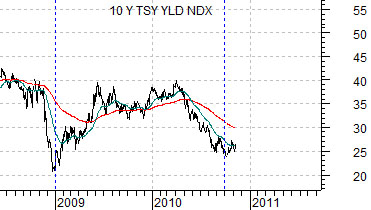
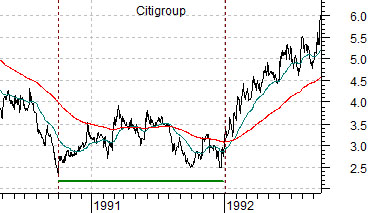
Below is a comparison between Citigroup (C) from 1990- 1992 and yield index for 10-year U.S. Treasuries from 2008 to the present day.
The argument is that we have made a bottom for yields during the seasonally weak autumn time frame and that we could see a sharp rise for long-term yields into 2011. Given that collapsing asset prices and rising bond yields rarely go hand-in-hand our view remains that cyclical growth should remain positive.
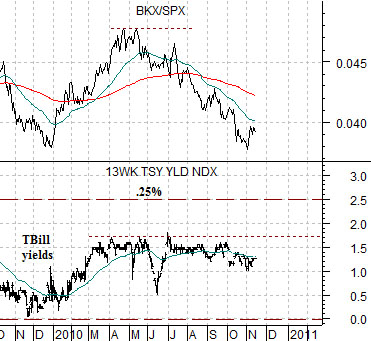
Next we feature a chart of the ratio between the Bank Index (BKX) and S&P 500 Index (SPX) along with 3-month TBill yields. The idea is that if long-term yields rise sharply this should lead to an upward trend for TBill yields. If TBill yields rise above .25% the Fed will follow with a hike of the funds rate but for this to happen we would expect to see a period of much stronger relative performance by the banking shares carrying the BKX/SPX ratio to new recovery highs.
Equity/Bond Markets
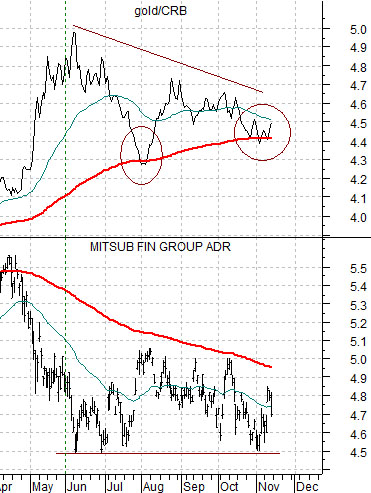
Gold prices declined rather sharply on Friday on an absolute basis but the gold/CRB Index ratio actually rose. The chart at top right compares the gold/CRB Index ratio to the share price of Japanese bank Mitsubishi UFJ (MTU).
The argument has been that the banks will start to do better once the gold/CRB Index ratio breaks firmly below its 200-day e.m.a. line. That has obviously not happened as of yet.
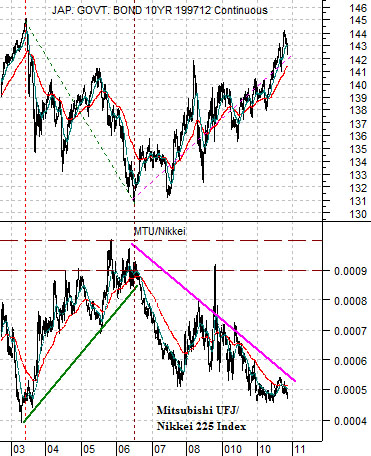
Below is a comparison between Japanese 10-year (JGB) bond futures and the ratio between MTU and the Nikkei 225 Index.
Why do we fixate over MTU and Japanese bond prices? This chart serves as something of an explanation. When Japanese bond prices are declining the share price of MTU rises relative to the Nikkei. Given that the Nikkei tends to rise relative to the S&P 500 Index during falling bond price trends this means that MTU is a markets outperformer.
Conversely when Japanese bond prices trend higher MTU tends to weaken relative to the Nikkei which, in turn, falls relative to the SPX. When bond prices are falling MTU is a stronger stock while when bond prices are rising… it is a dog’s breakfast.
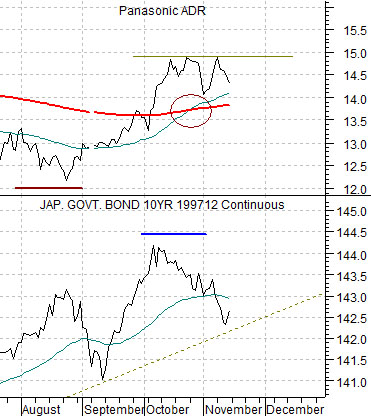
Below we show the JGB futures and the share price of Panasonic (PC).
PC was supposed to bottom ahead of the peak for Japanese bond futures. So far, so good. When it crossed up through its 200-day e.m.a. line the JGBs were supposed to turn lower. Once again… so far, so good. The problem is that we still lack a certain amount of confirmation from this potential trend change. We would like to see PC’s 50-day e.m.a. line cross up through the 200-day (which happened last month) and then have PC break to new highs with a solid close above 15. This is the chart detail that we are focusing on when we run this comparison in the back pages.