May 4 (Bloomberg) — Factory orders unexpectedly rose in March and more Americans signed contracts to buy previously owned homes, indicating the U.S. economy gained speed entering the second quarter.
The news tends to fit the markets through the meat of a trend but at the turns the markets will often appear almost irrational as prices drive in unexpected directions.
The point is that ‘the news’ suggests that the U.S. economy was accelerating into the month of April while the bond market has been arguing that the opposite is true. Since the recovery for asset prices that began in late 2008 has been predicated upon rising interest rates and cyclical strength our focus today is once again on the bond market.
Is there a ‘technical’ explanation for bond price strength over the past month that might serve as the foundation for an argument that we have been seeing is more random noise than pivoting trend? Put another way… every second month or so through the recovery the bond market has driven higher. Is it possible that this is still just a bounce and that bond prices are set to resolve lower following this Friday’s U.S. employment data?
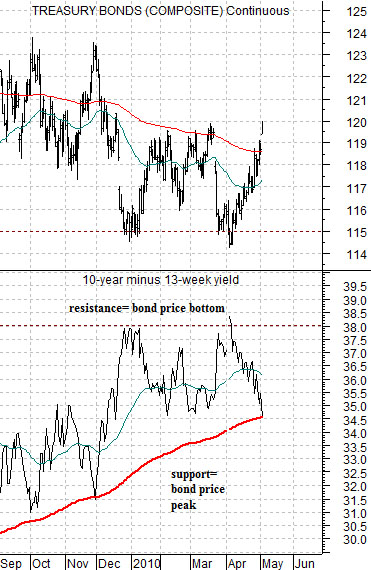
Below we show the U.S. 30-year T-Bond futures and the spread between 10-year and 3-month U.S. Treasury yields. The ‘spread’ is one representation of the yield curve.
We have argued that a spread in the vicinity of 3.8% represents the high end of the range. If long-term yields continue to rise towards 4% then the markets are showing us that it is time for the Fed to start to raise the funds rate.
If 3.8% (38.0) is an extreme then any time the spread rises to this level the path of least resistance should be lower. The chart makes the case that a spread of 3.8% tends to go with a bond price bottom while a decline for the spread back to the 200-day e.m.a. line has recently served as support.
Within the confines of the trend with 3.8% acting as resistance and the moving average line (currently around 3.45%) working as support an argument can still be made that the furious bond price rally that began in early April is mere random noise within an overall rising trend for long-term interest rates.
Equity/Bond Markets
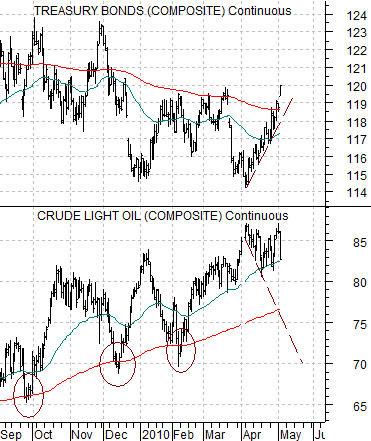
Below is a chart comparison between the U.S. 30-year T-Bond futures and crude oil futures.
We showed a similar chart on a few occasions a month or two back. The argument then was that the best time to go long the Cdn dollar was when crude oil futures prices had fallen back to or below the rising 200-day e.m.a. line.
This is a bit of a different spin on the same topic. Bond prices tend to rise when the commodity currencies and energy prices are falling so a reasonable short-term price top for the bond market could be reached around the time when the commodity theme had found a bottom. In other words… while crude oil futures prices fell close to 5% yesterday they are still some distance above the moving average line. Something closer to 75- 77 might serve as both a top for the rampaging U.S. dollar and a peak for the TBond futures.
Within a sea of red on our quote system yesterday the very rare ‘green’ prices really stood out. Wal Mart ended higher, of course, along with a number of the large cap drug stocks. This brings us to our next point.
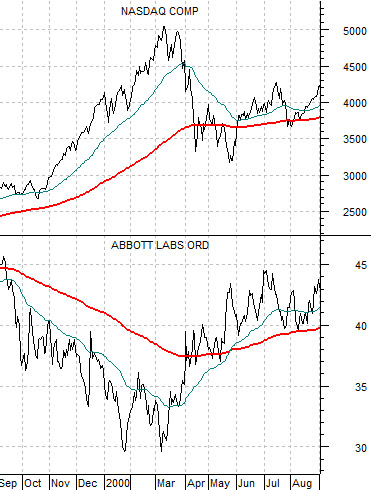
Below is a chart from 1999- 2000. The chart compares the Nasdaq Composite Index with the share price of medical products maker Abbott Labs (ABT).
Into the peak for the Nasdaq in March of 2000 so much money was chasing the cyclical trend that it served to drain buying away from a number of the defensive groups. On the chart this created mirror-image trends for the Nasdaq and ABT. Once the Nasdaq reached a peak the negative trend for ABT abruptly reversed with the stock pushing upwards.
One of the things we look for are ‘offsets’. A true cyclical peak might include a decline in the broad equity market but it should also include strength in sectors that had previously been weaker.
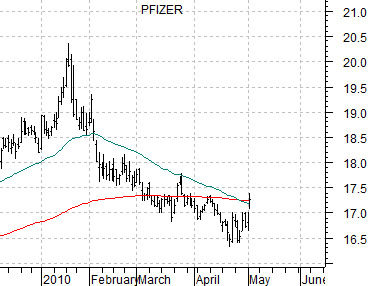
The chart of Pfizer (PFE) below shows that the sharp drop in the commodity currencies, commodity prices, and assorted cyclical themes led directly into a bit of a pop for the drug makers. If there is one ‘detail’ that suggests to us that what has been happening over the past week or so might be ‘real’ in a trend-changing manner… it would begin and end with the strength in the pharma stocks.