If one were to make a list of the various excesses within the markets these days we imagine that gold prices being ‘high’ and natural gas prices being ‘low’ would have to be included. The strange thing is that from a chart perspective these two oddities appear to be part of the same basic trend.
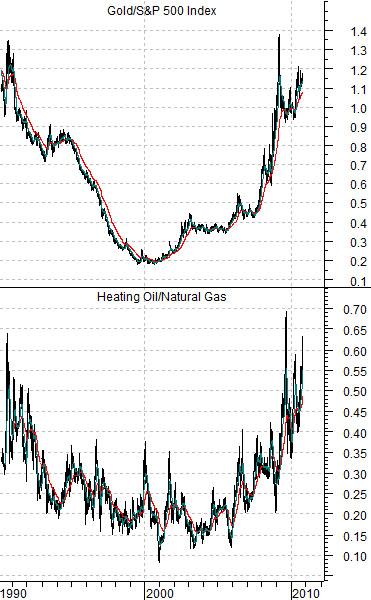
At right is a chart of gold futures divided by the S&P 500 Index along with the ratio of heating oil futures divided by natural gas futures.
In a sense the markets continue to run in decade-long trends. From 1990 into 2000 one of the dominant themes was falling Japanese long-term interest rates relative to U.S. rates. From 2000 into 2010 the trend reversed as U.S. yields were pulled down towards Japanese yields. Twenty years later we find that both countries effectively have 0% short-term interest rates.
The price of gold declined through the 1990’s relative to the broad equity market as the gold/SPX ratio fell from over 1.2 times down to roughly .2 times in 2000. From the Nasdaq’s peak in 2000 to the current time period the ratio has steadily risen back to very close to 1.2 times. In other words after a rather wild ride replete with a few crises the price of gold is now back to the same relative level that it traded for during the recession and real estate crisis of the early 1990’s.
The heating oil/natural gas ratio has followed the same basic path. During the Gulf War the ratio spiked to a peak in response to very strong crude oil prices. Over the ensuing decade the ratio worked lower as natural gas prices caught up with crude and heating oil.
In a sense the charts suggest that the build up to a housing and banking system crisis might well include ten years of strong gold and crude oil prices while on the other side of the problem we will return to a period of relative strength for equities and natural gas.
Another issue that we ponder from time to time has to do with the difference between Japanese and U.S. interest rates. Will the next decade include a broad recovery in Japan that sets us into a decade-long or multi-decade bond market price decline or will Japan’s deflationary pull continue to weigh on U.S. long-term yields? Will Japanese 10-year yields rise above 2.0% or will U.S. yields spend the next ten years flirting with a range of plus or minus 1.0%? Perhaps the answers to these questions lie with the gold/SPX and heating oil/natural gas ratios.
Equity/Bond Markets
On Friday the share price of Amgen was a bit stronger. Not hugely stronger of course but just peppy enough to catch our attention.
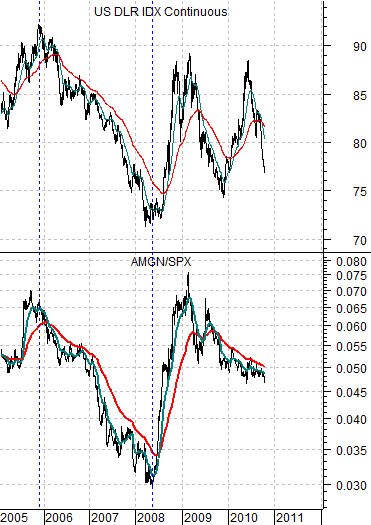
We have argued over the years that the direction of the share price of Amgen tends to relate in a broad way with the direction of the trend for the U.S. dollar. When Amgen starts to strengthen relative to the S&P 500 Index one should start to look for a dollar bottom.
At top right is a comparison between the U.S. Dollar Index (DXY) futures and the ratio between Amgen and the S&P 500 Index. The chart runs from the start of 2005 to the present day.
The point is that while the relationship is not perfect it does do a fairly good job of defining the dollar’s trend. Since early 2009 the AMGN/SPX ratio has been declining which suggests a downward trend for the dollar.
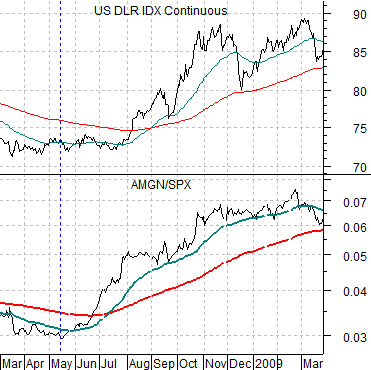
At bottom right we show a close-up view of the relationship from March of 2008 into March of 2009. Our focus is on how the ratio behaved just prior to the mid-year collapse of the commodities sector in 2008.
Notice that the ratio began to lift in May until it crossed above the 200-day e.m.a. line in June. By early July the 50-day e.m.a. had crossed up through the 200-day followed a few weeks later by the collapse in crude oil prices and reversal of the flow of capital back towards the safety of the dollar as investors began to flee ‘risk’.
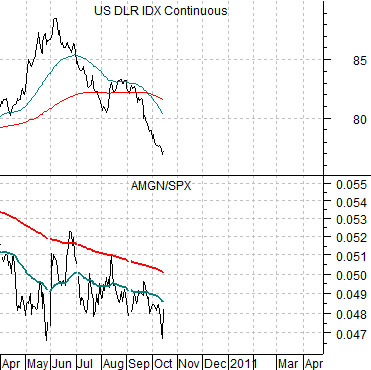
Below is the current situation. Obviously the AMGN/SPX ratio is still too low to indicate an imminent rise for the dollar but if the history were to repeat the time to start fixating on strength in the major biotechs might be fast approaching. Our basic view has been that we will have a stronger cyclical trend through the end of the quarter suggesting little in the way of dramatic dollar strength for another few months. If the AMGN/SPX ratio were to lead once again then it should be ready to cross up through the 200-day e.m.a. in November with a steady upward tilt into early 2011.