This is definitely a two-handed market. On the one hand the trend for equities and commodities remains lower. The commodity currencies are melting down, money is fleeing towards the Japanese yen and U.S. dollar, and a bid for gold has emerged.
On the other hand… the ratio between the S&P 500 Index and U.S. 30-year T-Bond futures is around 8.7:1.
And this is important because…?
Below is a chart of the ratio between the S&P 500 Index and the price of the U.S. 30-year T-Bond futures from late 1997 to the present time frame.
The chart shows that the S&P 500 Index has traded below 8.7 times the price of the TBond on a number of occasions over the past 15 years so this obviously is not a level that associated with major bottoms.
Yet… the message that we took from this chart was that by the time the SPX contracted to around 9 times the price of the TBond the equity markets were either at a bottom (1998 post-Asian crisis) or in the midst of some sort of crisis that was leading to a bottom.
The rapid decline in the ratio this year suggests that the markets are shifting right back into a ‘crisis’ state as bond prices soar while equity prices tumble.
The point, we suppose, is that the price of the SPX compared to long-term bond prices has declined to levels that, in the past, have been associated with the final stretches of bear markets (2002 and 2008) or somewhat temporary declines in front of significant rallies (2010 and 2011).
With the exception of 1998 it would have made sense to hold off on building long positions until the SPX/TBond ratio fell below 8:1. Fair enough. The problem with remaining bearish for too long at current levels is that the world may wake up one of these days to discover that recent weakness was less ‘crisis’ and more capital flows than most imagined.

Equity/Bond Markets
First below is a chart of the S&P 500 Index and U.S. 30-year T-Bond futures from 1987.
The argument is that the SPX extended its gains from May into August once the TBond futures started to essentially move sideways. Once the TBonds returned to a negative trend in August the SPX shifted into a topping process before eventually ‘crashing’.
Second below is a comparison from the current time period between the U.S. 30-year T-Bond futures and the Japanese yen futures.
Our suggestion is that the TBond futures are extending the rising price trend while the Japanese yen futures push upwards. If this is correct then as soon as the yen turns back to the down side we could see the bond market move from a bullish trend back to what might prove to be a dramatically bearish trend.
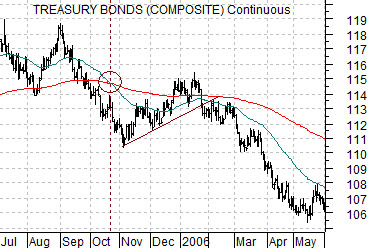
We were looking for some kind of comparison that might work for the Japanese yen and eventually settled on the TBond futures from 1005- 06. Whether this is ‘fair’ or not is open to debate but we have placed the charts below using the ‘cross over’ by the 50-day e.m.a. line through the 200-day e.m.a. line as our starting point.
In theory the yen is in approximately the same position today that the TBonds were in January of 2006. A break by the yen back below its 50-day e.m.a. line over the next while may indicate that the currency is going to resolve lower into the autumn.