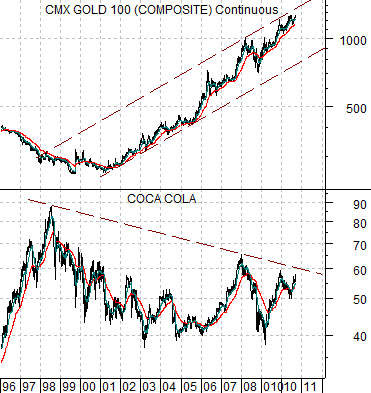
We are going to start off with a macro perspective today before moving on to our main topic. At top right is a chart comparison between gold futures and the share price of Coca Cola (KO).
We are asked quite often when gold prices will finally turn lower. In yesterday’s issue we made the case that gold is lagging the commodity trend in a manner similar to the way the Nasdaq extended to a peak in 2000 after most of the U.S. large cap sectors started to weaken. In a sense there is a relationship between weakness in the large caps and the rising trend for gold prices.
The chart suggests that gold prices have been moving higher as the share price of Coke has been trending lower. Not just Coke, of course, but everything from IBM to Merck and Johnson and Johnson to Carnival. From this point of view the start of a negative trend for gold prices may well coincide with one or more chart ‘break outs’ by the large cap names. If KO were to push up into the 60’s or if IBM were to gain a foot hold above 130 it would make sense- to us- that money would stop finding reasons to chase gold prices higher.
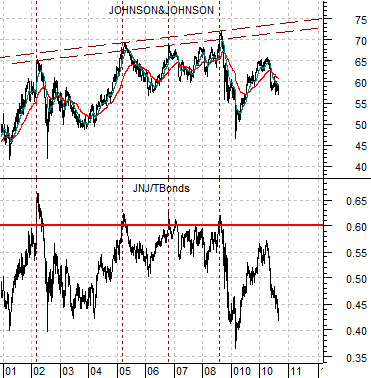
At bottom is a comparison between the share price of Johnson and Johnson (JNJ) and the ratio between JNJ and the price of the U.S. 30-year T-Bond futures. We have done this one on a few occasions in the past but wanted to build in the message somewhat on the following page.
Over the past decade price peaks for JNJ have occurred when the ratio between JNJ and the TBonds moves above .60. Obviously this only happens every few years but the point is that as long as the ratio remains well below .60 one can hold JNJ and collect a few dividends.
Reasonably significant bottoms for JNJ have been associated with ratio levels at or below .45. In other words when JNJ trades for less than 45% of the value of the TBonds (last seen close to 132) the stock has tended to be a ‘buy’ and when the stock increases to more than 60% of the TBonds it has generally been a ‘sell’.
With the TBonds around 132 anything south of 60 for JNJ is reasonably attractive while a price closer to 80 becomes somewhat less so. With this in mind we will push on to our next point.
Equity/Bond Markets
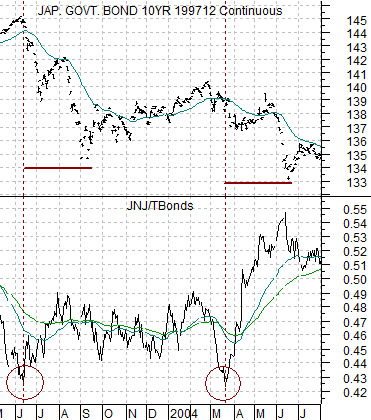
Below is a comparison between the Japanese 10-year (JGB) bond futures and the ratio between JNJ and the TBond futures from 2003- 2004.
In both 2003 and again in 2004 the JNJ/TBond ratio fell to a bottom close to .43.
Almost exactly three months later the Japanese bond futures reached a bottom. The ratio bottomed in June of 2003 with the bonds hitting a low in September and then the ratio made a second bottom in March of 2004 with the bonds declining into June.
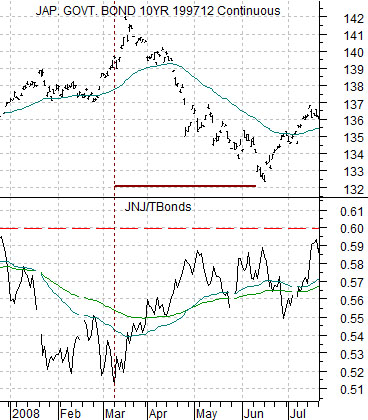
Below we show the same comparison from 2008.
While the ratio did not move below .45 it did make a low in March of 2008 around .51. Three months later in June the Japanese bond market reached a price bottom.
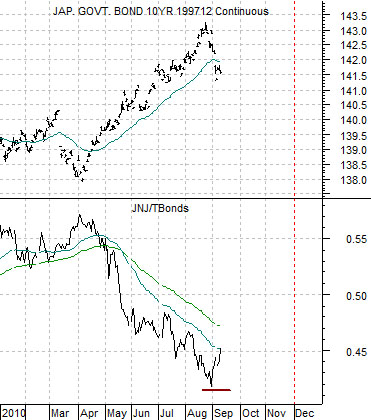
The chart below shows the current situation. From April through August money pushed away from the equity markets and moved towards the bond market. This resulted in a steady price rise for long-term Treasuries as well as long-term Japanese bond futures.
With the JNJ/TBond ratio falling below .45 in August a case can be made that this was a ‘significant bottom’. Obviously we can not know that for sure at this time but we suspect that it is at least a reasonable assumption.
If the JNJ/TBond ratio has made a bottom then it stands to reason that we could be looking at a price low for bonds some time around the end of November. Our thought is that this might help fuel the cyclical recovery that we have been looking for through the balance of this year as money moves away from the bond market and back towards the equity market.