For good or for bad financial markets trends are driven by capital flows. Trends start when no one is paying attention, get ‘over bought’ quickly enough to flush out most of the early adopters, last far longer than one believes possible, and then end once the majority have drunk the koolaid. From time to time we return to the idea of the ‘hardest trade’ which is, more of less, the opposite of what most people are doing. We mentioned, for example, in July of 2007 that the ‘hardest trade’ was selling bank shares and then in early 2009 the ‘hardest trade’ was going long equities. Today investors are still herding towards cash, bonds, and gold while every ratchet higher in the stock markets is met with warnings of imminent doom.
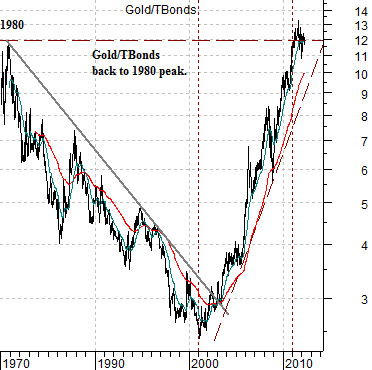
In any event… we just went on a bit of a ramble so we had best get to our point before we run out of time and space. First is a chart of the ratio between gold futures prices and the U.S. 30-year T-Bond futures from 1980 to the present day.
Notice that gold prices declined relative to bonds for 20 years and then rose relative to bonds for a decade or so. The end result, oddly enough, is that the price of gold today relative to the price of the U.S. 30-year T-Bond futures is the same as it was more than 30 years ago.
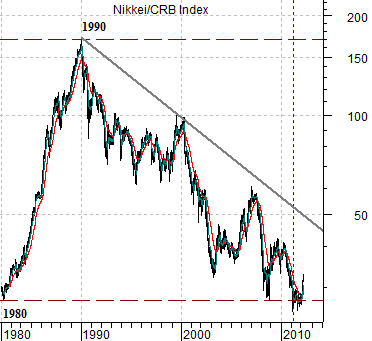
Below is a chart of Japan’s Nikkei 225 Index divided by the CRB Index.
The Nikkei/CRB Index started at a bottom in 1980, rose for 10 years, and then ground lower for the next 20 or so years. Recently the Nikkei relative to the CRB Index had fallen back to the lows of 1980.
There are a number of ways to look at this. One would be that after 20 years of weakness and investor neglect from 1980 into the early 2000’s gold prices finally swung back up ‘on trend’. If this were true then one could argue that the next sector to ‘take a turn’ could well be Japanese stocks. This has been, of course, our thesis.
Another spin on this might be that every dog has now had its day. Stocks went up, bonds went up, eventually crude oil prices went up along with base and precious metals prices. In a sense this would mean that most relative price adjustments have already been made with the gold/TBond and Nikkei/CRB Index ratios back to the levels associated with the start of the trend in 1980.
Equity/Bond Markets
The theme that we were working with today had to do with markets that had been ‘left behind’. Our view is that capital tends to abandon one or more sectors as it chases growth until eventually the trends swing back in the other direction.
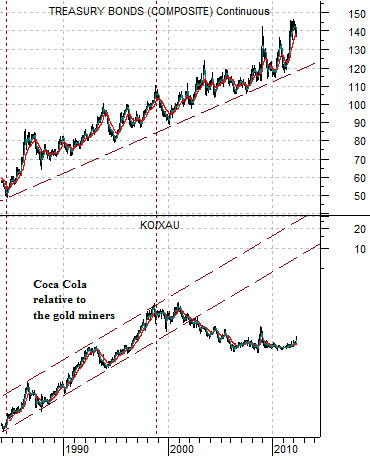
Below is a chart of the U.S. 30-year T-Bond futures and the ratio between Coca Cola (KO) and the Philadelphia Gold and Silver Index (XAU).
The problem with concurrent relationships is that there is no way of knowing which side is right and which side is wrong. As shown the chart appears to argue that the share price of Coke should rally significantly relative to the gold miners as it catches up to the rising trend carved out by the bond market. Another perspective might be that bond prices have spent the last decade rising even as inflationary pressures from stronger commodity prices escalate. In any event… it is sort of an interesting chart so we thought that we would include it today.
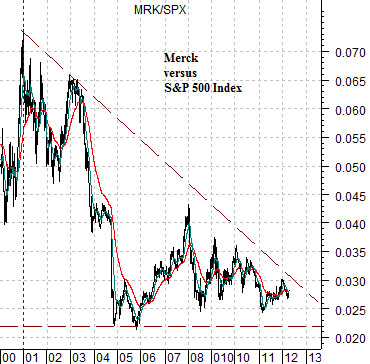
Next is a chart of the ratio between Merck (MRK) and the S&P 500 Index (SPX). Notice the collapse in the MRK/SPX ratio through 2004. This was the point in time when energy prices were really starting to gain upward momentum. Our view is and has been that the pharma stocks are, more or less, the offset to commodity price strength. The stronger the share prices of the drug stocks the greater the chances that energy prices will flatten out or decline from current levels.
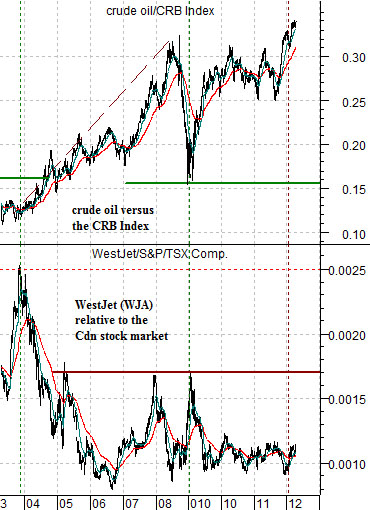
Then we have a comparison between the crude oil/CRB Index ratio and the ratio between the share price of Canadian airline WestJet (WJA on Toronto) and the Canadian stock market (S&P/TSX Composite Index).
Notice that when the crude oil/CRB Index ratio began to drive upwards in late 2003 the offset was relative weakness in WestJet. It is conceivable that… one of these days… oil prices will actually weaken. The offset to a rising crude oil/CRB Index ratio is pressure on the autos and airlines. Our logical leap is that weakness in energy prices will actually lead to strength in the autos and airlines.