Two of our favorite arguments are that the markets repeat cycles in unexpected ways and that cycles tend to run from decade to decade. We thought that we would expand on these thoughts somewhat in today’s issue.
From time to time we have mentioned that recent cycles have gone commodities (1970s), consumer/Japan (1980s), capital spending/tech (1990s), and back to commodities (2000s). If the pattern persists then the current decade should be skewed towards the consumer/financial/Japan theme.
The twist is that while both the 1970s and 2000s were dominated by rising commodity prices the major difference was found in the reaction by the bond market.
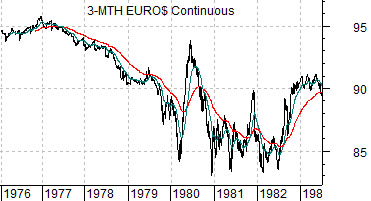
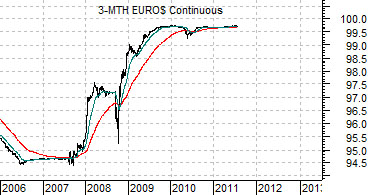
Below we show a comparison between 3-month eurodollar futures from 1976 into 1983 as well as 2006 to the present day.
Keeping in mind that falling eurodollar PRICES represent rising short-term yields while rising eurodollar PRICES denote falling yields we can see that from 1977 into 1981 3-month interest rates rose from around 5% to 17% while from 2007 into 2011 rates fell from around 5.5% to very close to 0%.
The point is that strong commodity prices through the 1970’s went with higher interest rates while the recent commodity cycle went with falling interest rates. The markets have repeated the cycle (commodity prices) in an unexpected way (falling yields).
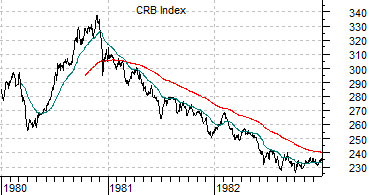
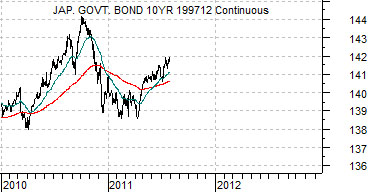
Next is a comparison between the CRB Index from 1980 through 1982 and Japanese 10-year (JGB) bond futures from 2010 to the present time period.
This chart comparison represents, in a sense, our thesis. Following the commodity theme of the 1970’s the necessary ‘driver’ to shift relative strength towards Japanese asset prices was a weaker CRB Index. This time around the offset should be a declining trend for long-term Japanese bond prices. The trend was disturbed somewhat earlier this year by Japan’s quake/tsunami which slowed growth and pushed bond prices higher. If our thesis proves to be correct, however, then in due course Japanese bond prices should swing back to the down side through the end of 2012.
Equity/Bond Markets
It is always curious when the markets feature a trend that is so similar to something that has happened in recent years and yet is almost exactly the opposite.
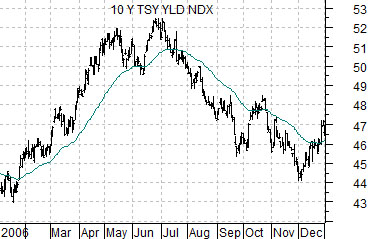
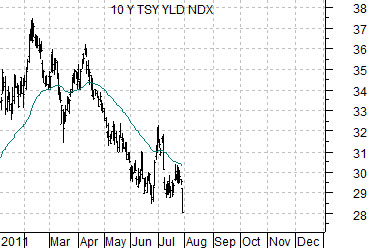
Below are two charts of U.S. 10-year Treasury yields. The top chart is from 2006 while the lower chart is from 2011.
In 2006 10-year yields trended higher through the first half of the year and then turned lower through the second half of the year. This time around yields have declined from February through July.
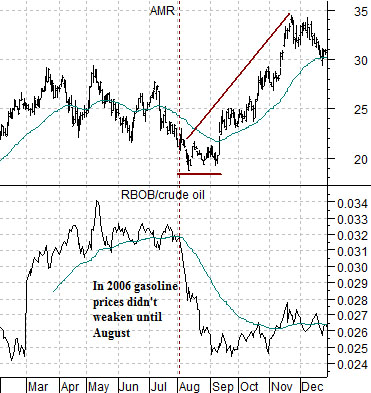
Below is a chart of the ratio between gasoline futures (RBOB) and crude oil futures along with the share price of airline AMR from 2006.
In 2006 the first half of the year was dominated by strength in gasoline futures prices. This pushed the RBOB/crude oil ratio higher through the month of July while applying downward pressure on the share price of AMR. Notice that AMR did not bottom until a month or so after the gasoline/crude oil ratio began to weaken through the month of August.
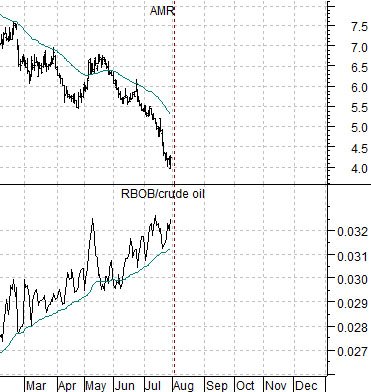
Last is the same comparison for the current time frame.
The trend this year has featured strength in both gasoline and Brent crude oil futures. As one might expect this has created a downward trend for the airline stocks with AMR pushing to new lows through the month of July. In a sense we are repeating 2006 with strong gasoline and weak airline stocks through into the summer even as the bond market’s reaction proves to be the exact opposite with yields falling instead of rising.
The point? Look for falling gasoline and Brent crude oil prices through the late summer along with rising yields and a potential upward pivot in the share prices of the airlines as weaker energy prices are perceived as a positive for the consumer cyclical sectors.