When the equity markets turn bearish on a sustained basis you can usually look back at the way the trend was deteriorating and realize that the outcome should have been obvious. While the equity markets certainly were weaker yesterday and were, most likely, in need of some kind of temporary respite from the rising trend, we really haven’t seen the kind of ‘cracks’ in the trend that would suggest that this is anything more than a short-term correction. So far.
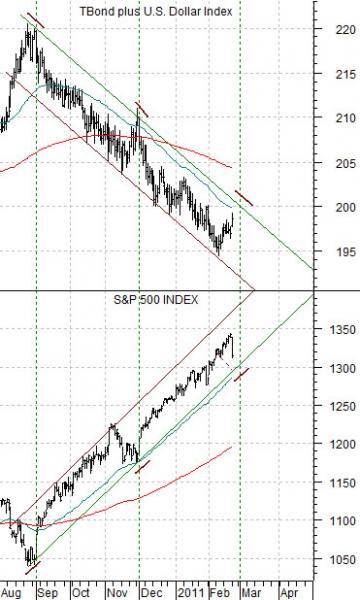
Below is a chart comparison between the S&P 500 Index (SPX) and the sum of the U.S. 30-year T-Bond futures and U.S. Dollar Index (DXY) futures.
We realize that the current Middle Eastern/North African situation could escalate to the point where the ongoing supply of crude oil is threatened. We well recall the 3-month equity bear market in 1990 that went with Iraq’s invasion of Kuwait and fully understand the importance of energy prices and availability to global growth. On the other hand… through trading yesterday the markets have not indicated in a clear manner that the crises in Tunisia, Egypt, and Libya are of a magnitude that threatens the equity market’s bullish trend.
The chart shows that at the end of August last year the low point for the SPX was made at the high point for the sum of the TBonds and dollar.
Three months later the equity markets corrected to the down side once again with the sum of the TBonds and dollar rising to a second peak.
If the pattern persists the SPX would decline to a second bottom within the rising trading channel three months after the November decline. This correction would go with offsetting strength in the bond market and dollar as money moves away from equities towards the perceived safety of the dollar and Treasury market.
The point is that while the trading channels shown on the chart may not be exact the only thing the markets are doing to this point in time is repeating the tendency to sell the equity markets lower every three months while temporarily lifting the dollar and bond prices. If history were to repeat the pressure would run into the end of this month to be followed by a brisk rally back to last week’s highs through the first half of March.
Equity/Bond Markets
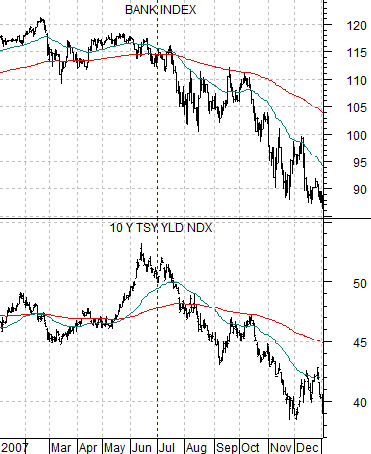
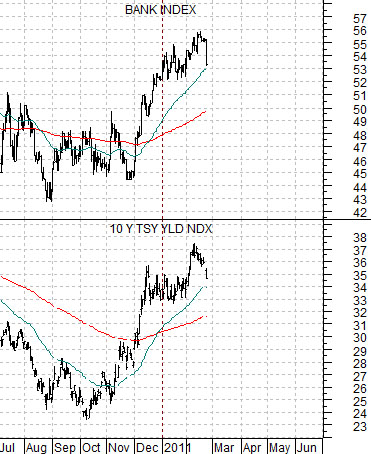
Below is a chart of the Bank Index (BKX) and 10-year Treasury yields from 2007. Next we show the same comparison for the current time frame.
The argument is that indications of cyclical weakness began to show up around the middle of 2007 followed a few months later by peaks in a number of key markets- including the Chinese stock market- in the autumn of that year. Pressure from rising energy prices accelerated rotational pressure into the summer of 2008 leading into a all-out collapse of both the equity and commodity markets.
If we compare the erosion of the trend for both the banks and long-term yields in 2007 with the current situation we can see that there are considerable differences. Both the Bank Index and 10-year yields remain well above their respective 200-day e.m.a. lines which suggests that what we worked through yesterday was more of a correction than a trend-ending turn lower.
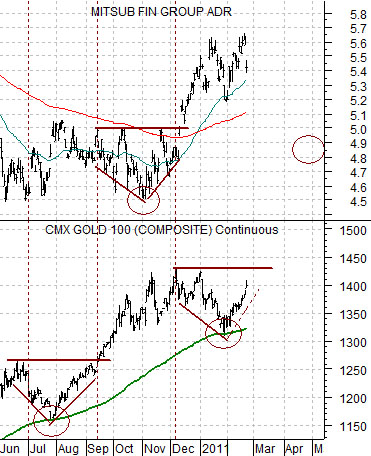
Below is a comparative view of the share price of Japanese bank Mitsubishi UFJ (MTU) and gold futures.
We have argued that the ‘laggard banks’ are trading inversely to gold. In other words strength in gold tends to go with weakness in the banks while weakness in gold tends to go with a rising trend for the bank shares.
The chart shows the gold made a bottom at the end of July and again six months later in late January while MTU pivoted higher around the end of October last year. If the six-month pattern continues with gold reaching new highs next month then the next bout of strength for the laggard banks may show up around the end of April.