It is not that we don’t follow the news although we pay less attention to the headlines than most. It is merely that we find applying what is happening at present or, as is often the case, what has already transpired, to the financial markets that are discounting the future somewhat challenging.
The point is that for the lion’s share of any trend the direction of prices makes sense within the context of ‘the news’. It is only at the start and the end of the trend when things tend to go awry. An example that jumps to mind would be the first quarter of 2000 as long-term Treasury yields began to decline. This made absolutely no sense to most as 4th quarter 1999 GDP numbers showed rampant growth even as the Nasdaq pushed on towards 5000. If one were trying to trade markets off of the headlines this would have been a difficult time period but… if one takes the opposing view and accepts the forward-looking nature of the markets then the ensuing recession and equity/commodity bear market would have made more sense.
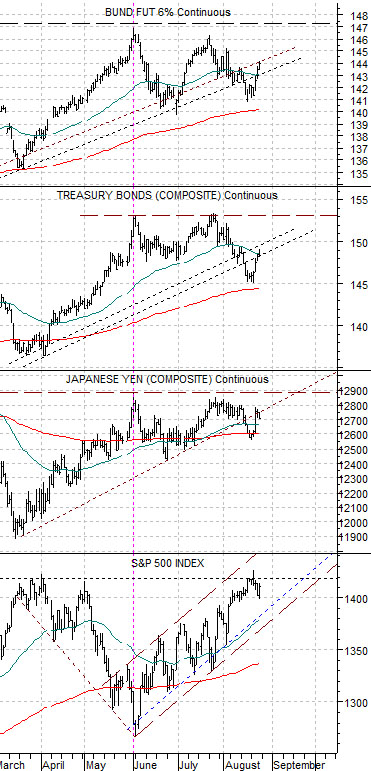
All of this is, of courses, a preamble to a point. Not a new point to be sure but a point nonetheless. Below is our chart comparison between the S&P 500 Index, Japanese yen futures, U.S. 30-year T-Bond futures, and German bund futures.
The argument has been that the Japanese yen trades with the bond markets of ‘safe haven’ countries. The yen and bond futures rise together when money moves into less risky sectors and then decline together as confidence and conviction expand.
Our view was that as soon as the yen and bond futures made a peak the S&P 500 Index should begin to trend upwards. Which, for all intents and purposes, is what has happened since the end of May.
If the yen and bond futures trade essentially sideways then the bulk of the gains should come from the defensive sectors with periodic rallies from the cyclicals in response to any kind of bond price weakness. If the yen and bond futures decline to the point where the TBond futures fall below the 200-day e.m.a. line then the focus will shift more towards the cyclical sectors.
Risk increases any time the bond market throws in a price rally but, as mentioned above, as long as the yen and bond futures hold below the recent highs the basic trend for the S&P 500 Index appears higher.
Equity/Bond Markets
We often think of the markets in such circular terms that making any kind of explanation becomes difficult. Falling interest rates go with falling asset prices in real time yet put upward pressure on yields with a 2-ish year lag. That makes falling yields negative today and positive in the future.
We often argue that falling yields are always a positive for financial asset prices even though stock markets tend to weaken as yields decline. The twist is that it isn’t falling interest rates that are the problem but rather the ‘reason’ rates are falling.
This might be easier to understand when viewed as a price to earnings multiple (PE).
Falling interest rates should expand equity valuations which, in turn, increases the PE multiple. The ‘reason’ interest rates are falling has much to do with the ‘E’ as corporate earnings tumble so we tend to get a higher PE multiple because stock prices decline less than earnings.
In any event… we are going somewhere with all of this. Hopefully.
In the latter stages of a bearish cyclical trend the markets have shown a tendency to move money towards the biotechs. The biotechs are a fairly aggressive sector with earnings that are not closely tied to cyclical growth. Early in an equity bear market the biotechs sell off. Some time closer to the end of the cycle the biotechs show fairly decent relative strength.
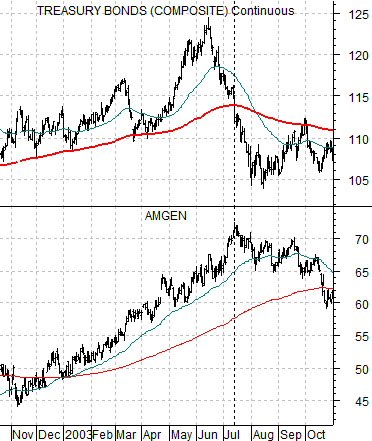
Below is a chart of the U.S. 30-year T-Bond futures and the share price of Amgen (AMGN) from 2002- 03.
What we are looking at is the tail end of the 2001- 02 cyclical decline. We are using the term ‘cyclical decline’ instead of ‘equity bear market’ because the S&P 500 Index bottomed in the autumn of 2002 while the true low for the cyclical trend did not occur until mid-2003 when long-term bond prices reached a peak.
The top for the U.S. 30-year T-Bond futures was reached in June of 2003. Yet the TBonds had made a series of price decline through 2002 and 2003 without altering the rising trend. What happened in the summer of 2003 that helped show that this time was indeed different?
Our argument is that two things transpired. First, the TBond futures broke below the 200-day exponential moving average line. Second, the share price of Amgen stopped rising. The former argued that economic growth had or would improve to the point where true cyclical stocks and sectors were set to rise in price while the latter confirmed that money was starting to move towards these sectors (i.e. sell biotech, buy banks and airlines).
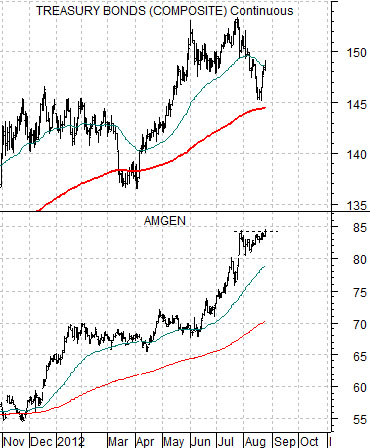
Below is the current situation. Our view is that we are late in the cyclical decline because Amgen is showing considerable price strength. Yet the push to marginal new highs for AMGN at the end of last week suggests that there isn’t much in the way of true conviction that the bond market is set to bust down through the moving average line. When all is said and done… it appears as if the markets are still awaiting either a Eurozone crisis resolution or, perhaps, an indication that U.S. jobless claims are once again declining.