The rally in the Greek stock market following the news of a merger between somewhat shaky banks helped propel stock prices higher yesterday. Risk on.
We are going to start things out today in a rather strange direction. It has- we hope- something to do with a point that we may or may not be able to make on the next page.
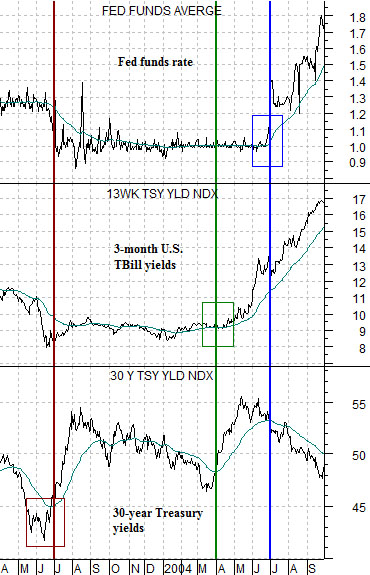
At right is a chart of, from bottom to top, 30-year Treasury yields, 3-month TBill yields, and the Fed funds target rate from April of 2003 through September of 2004.
We have done this argument before but after the Fed stated recently that the funds rate will be held extraordinarily low into 2013 we wanted to quickly do it again.
The process of working up to a Fed funds rate increase begins with a low for long-term yields. Once long-term yields start to rise- as they did around the end of the second quarter in 2003- the markets begin to add upward pressure to yields across the curve. The argument is that it takes roughly 9 months from the low point for 30-year yields to the point in time when TBill yields start to swing higher and from there another 3 months until the funds rate is hiked.
The chart shows that 30-year yields started to rise in mid-2003, TBill yields turned higher in the second quarter of 2004, and the funds rate ticked upwards in mid-2004.
This is the sequence that the markets should follow if… the pressures on the banking system are going to abate. This is the sequence that the markets did not follow after long-term yields hit bottom at the end of 2008. This is the sequence that will make sense if, and only if, gold prices actually stop rising and break back below their 200-day exponential moving average line.
The final point is that if long-term yields have recently made a low and are turning higher on better news from Greece then no matter what the Fed Chairman says this month, next month, or even three quarters from now… the Fed funds rate should be ready to swing upwards some time during the third quarter of 2012.
Equity/Bond Markets
Is the second time the charm?
The argument on the first page was that once long-term yields bottom and start to rise the bond market will slowly lift shorter and shorter-term yields until 3-month TBill yields rise above the Fed funds rate. About one year after the low for 30-year yields the Fed funds rate should start to lift.
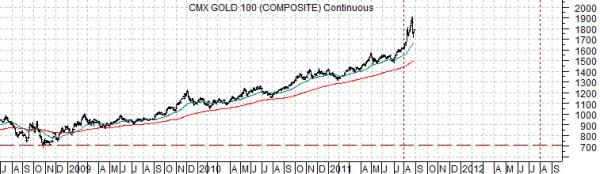
Long-term yields bottomed at the end of 2008 but with the benefit of quite a bit of hind sight we can get a sense of what has happened this year. The argument is based on the idea that gold and the banks are trading inversely.
At top right is a chart of Bank of America (BAC) and the ratio between gold and the CRB Index. From the early 1980’s into 2007 the gold/CRB Index ratio traded more or less between 1.2:1 up to 2.2:1. The ratio exploded to new highs in 2007 to signal the leading edge of the banking crisis.
Notice that… the gold/CRB Index ratio is still trending higher. The first bottom for yields at the end of 2008 didn’t lead to gold price weakness suggesting that the markets had to back things up, make a second bottom for yields, and start the process all over again.
Our view, by the by, is that the trend for gold over the next year will look somewhat like Hong Kong’s Hang Seng Index from 1997 into 1998. If the banks finally stage a successful recovery then over the next year we could see gold prices return to the 700 level with a few dramatic declines and knee-shaking rallies thrown in along the way.