From Bloomberg yesterday, “U.S. stocks climbed, sending the Dow Jones Industrial Average to its first close above 13,000 since 2008, as confidence jumped to a one-year high and oil retreated for a second day. The euro gained before the European Central Bank provides funds tomorrow to support banks.”
To start off today all we really wanted to do was go back over an argument that we have made in these pages on quite a few occasions of late. The essential point was that if nothing changes don’t fade the trend.
By ‘nothing’ we refer, of course, to the trends for the U.S. dollar and bond market. If the dollar is not too strong or too weak while long-term Treasury futures prices essentially track sideways then the offset is and has been a rising stock market.
Below is our comparison between the S&P 500 Index (SPX), the price spread or difference between 30-year and 10-year Treasury futures (30- 10), and the sum of the price of the U.S. 30-year T-Bond futures plus the U.S. Dollar Index (DXY) futures.
The 30-10 spread is a reflection of both the trend for the bond market and the shifting of the yield curve. The spread rises as bond prices rise and declines as bond prices move lower. The argument is that rising bond prices suggest impending economic weakness which is viewed by the markets as bearish for the cyclical sectors. Declining bond prices suggest impending cyclical strength which tends to be negative for the interest rate sensitive sectors. Flat bond prices, on the other hand, appear currently to represent the best of all possible worlds for the stock market.
A stronger dollar pinches commodity prices while a weaker dollar may point to a lack of faith in the U.S. recovery. A flat dollar appears to be viewed as a positive from almost any perspective.
The point is that the trend that began back in mid-December has not changed in even the slightest way, shape, or form. The SPX is following a path that points to something north of 1400 as we round out the quarter next month.

Equity/Bond Markets
In 2010 and 2011 the cyclical trend rose to a peak around the end of the first quarter of the year followed by nasty declines into the autumn. Since we start the month of March tomorrow we thought we should present a perspective that suggests that this time may indeed be different.
The point here is that if recent history repeats… one should be lightening up on long positions around the end of March. While that may prove to be a wise course of action an argument can be made that the current rally is going to last well beyond the current quarter. To make this case we are going to use the ratio between the share prices of Alcoa (AA) and Newmont (NEM).
The aluminum/gold (i.e. AA/NEM) ratio tracks with the cyclical trend. The view is that AA represents industrial recovery and growth while NEM trends with gold prices which, in turn, strengthen on falling interest rates and economic uncertainty.
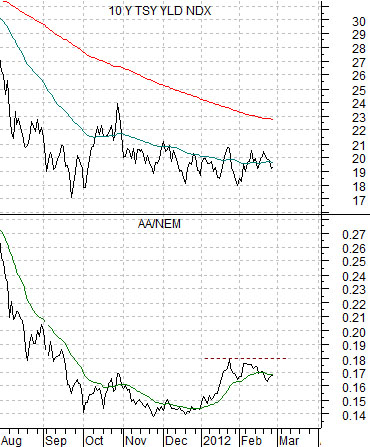
The chart below of 10-year Treasury yields and the AA/NEM ratio covers the time period from late 2009 through 2010. Notice that the ratio peaked in January of 2010 and then bottomed in September. The next chart shows the same comparison from late 2010 through 2011. In this example the ratio topped out around the end of the first quarter and then bottomed nine months later in December.
Last is the current situation. The ratio remains far below the 2010 and 2011 peaks of around .30. In fact, it has only been on the rise for a couple of months. The argument is that unless the AA/NEM ratio buckles in the near futures the recent tendency has been for it to trend upwards for around 9 months before swinging lower once again. If history were to repeat this would keep the cyclical trend positive through September.