We are most certainly not high-frequency traders. We are not interested in day trading or in flattening the books ahead of the close so as not to carry a position through the night. We do our best to filter out as much of the market’s random noise as possible and attempt to hold to a fairly long-term point of view. Every now and then, of course, the markets shift into crisis mode and all of our themes, theses, and arguments seem to fly right out the window.
When the markets get fast we tend to slow down. When prices become increasingly volatile we usually shift to more macro perspectives. For good or for bad… that is the best way that we know how to remain insulated from the allure of both fear and greed. Every now and then… it even works.
The reality at present is that oil prices are rising rapidly and forecasters are rushing to put forth the most aggressive price targets. We have absolutely no idea whether crude oil is going to get much beyond the 110- 115 region but that is an issue for another day.
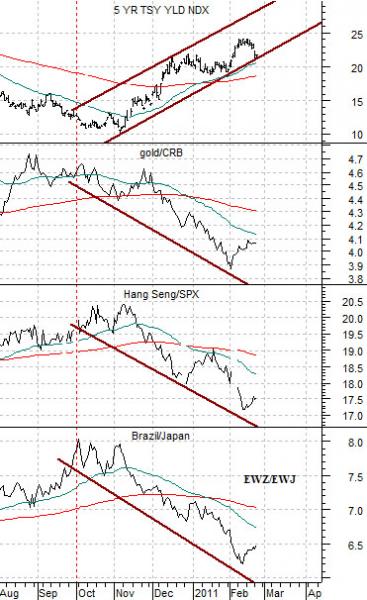
Below is (we hope) a fairly rational view of the current trend. Notice that even as oil prices surge higher all of the trends shown on this comparison remain basically intact.
The chart compares 5-year U.S. Treasury yields, the ratio between gold and the CRB Index, the ratio between the Hang Seng Index from Hong Kong and the S&P 500 Index, and the ratio between the Brazil etf (EWZ) and the Japan etf (EWJ).
The argument is that when China began to raise interest rates in October of last year in response to ongoing cyclical strength and inflationary pressures new trends developed within the markets. Typically every time long or short-term interest rates change direction something within the equity markets changes as well. This time around as U.S. Treasury yields began to move higher we started to see relative price weakness for gold as well as price weakness in Hong Kong compared to the SPX and in Brazil relative to Japan.
Our view is that positive growth has become a negative for the emerging markets due to inflationary pressure and a positive for the developed markets. On a seasonal basis these pressures should continue through the second quarter of this year.
Equity/Bond Markets
To finish off the first page commentary we should add that we are firm believers in the seasonal trend. The seasonal trend tends to lead to a peak for cyclical growth in May or June and a bottom for cyclical growth in October or November.
The sense of impending doom that goes with the autumnal low point for cyclical growth tends to explain why the markets ‘crash’ or bottom around the month of October. It also explains why, for example, long-term yields bottomed at the end of September last year and forms part of our view that yields will continue to rise into the second quarter of this year.
The problem with the seasonal trend is that it impacts the markets in different ways from year to year. The overlay is weakness into the autumn and strength into the spring but there are times when weakness is positive and other times when strength is viewed as a negative. This is particularly true when resources are in short supply and inflationary pressures are on the rise.
China, India, Brazil, and even Russia are tightening credit and raising interest rates to fend off inflation. The U.S., Europe, and Japan remain so far under trend that growth can continue in the foreseeable future without putting upward pressure on short-term yields.
The point is that while the markets recognize that the emerging markets have stronger growth this expansion has become something of a negative for financial asset prices in the BRIC markets and a positive for financial asset prices in the developed markets.
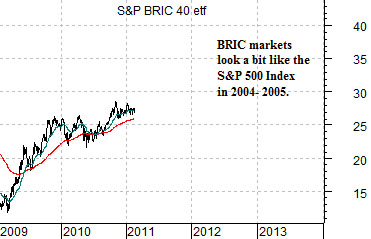
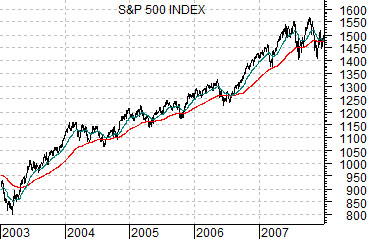
Below is a comparison between the etf representing the S&P BRIC 40 Index (BIK) from 2009 to the present day and the S&P 500 Index from 2003 through 2007.
There is a certain visual similarity between the trend for the BRIC etf coming out of the 2009 bottom and the SPX through the early stages of the recovery in 2003. The argument here is that while the SPX continued to rise during 2004, 2005, and into 2006 it underperformed the BRIC markets each and every year from 2001 into 2008.
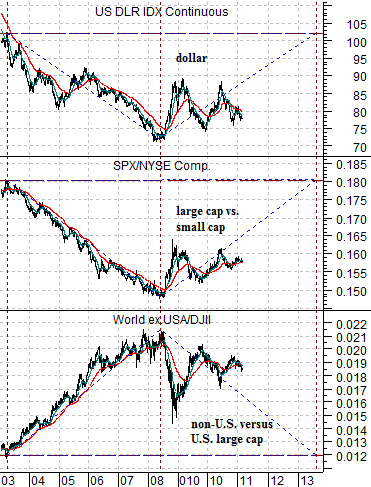
Further below is a chart of the U.S. Dollar Index (DXY) futures, the ratio between the SPX and the NYSE Composite Index (we use this as a measure of the relative strength of large cap to small cap), and the ratio between the Morgan Stanley World ex-USA Index (everything but the U.S.) and the Dow Jones Industrial Index (U.S. large caps).
Coming out of the recovery in 2003 the major trends favored (1) a weak dollar, (2) small caps compared to large caps, and (3) foreign compared to U.S. large cap.
From the commodity price peak in 2008 the major trends have included (1) a stronger dollar (even if it rarely feels like it), (2) large cap over small cap, and (3) U.S. large cap compared to foreign.
The point is that while real economic growth is better in the emerging markets financial asset prices are better in the developed markets. The seasonal trend suggests that this ‘split’ will become even more pronounced over the next few months as cyclical growth and long-term yields push higher into the second quarter.