We continue to believe that the equity markets will resolve somewhat higher into May. The ‘stop’ on this view is weakness in the Canadian dollar sufficient to bring it back to test or even break support at the .7700 level. As mentioned yesterday as long as the Cdn dollar remains flat to higher against the U.S. dollar we are going to do our best to remain equity markets positive. The caveat is that we expect the Cdn dollar will weaken and we expect that the equity markets will return to test the cycle lows into this year’s third quarter.
Our thesis revolves around the argument that there is a seasonal cycle or bias within the markets that tends to create the impression that growth is expanding into the May-June time frame and slowing or contracting into October or November. The twist is that while this bias repeats each and every year its impact on the markets can vary quite markedly. In other words… the impression that economic growth is improving as we move into the month of May can be a positive or a negative depending on how the markets are stressed. If, for example, the markets are worried about inflationary pressures then growth can be viewed as a negative. That is certainly not the case this year however.
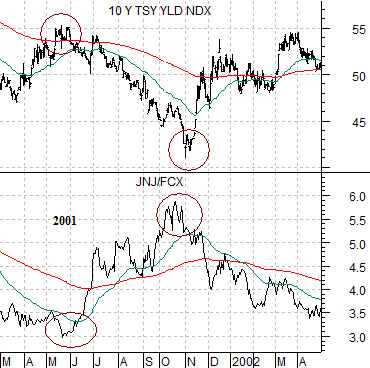
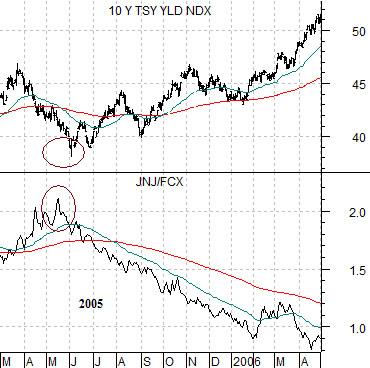
Anyone who has been around the markets for any length of time will have heard- and likely ignored- the adage ‘sell in May and go away’. The problem with this is that it only works occasionally and, even then, in unexpected manners. To explain… we hope… we have included two chart comparisons below of the yield index for 10-year U.S. Treasuries (TNX) and the ratio between the share prices of Johnson and Johnson (JNJ) and FreePort McMoRan (FCX). The top chart is from 2001 while the lower chart is from 2005.
In 2001 the JNJ/FCX ratio bottomed in May and rose into October as long-term yields declined. In other words the trend changed in May and then again in October to reflect the direction of long-term yields. Falling yields from May through into October represented slowing growth which, in turn, went with better relative action in the defensive (i.e. JNJ) equities relative to the commodity cyclicals (FCX).
On the other hand… while the markets rather abruptly changed trend in 2005 it was in exactly the opposite manner as 10-year yields turned higher as the JNJ/FCX ratio declined. The point? The May/June time frame tends to go with trend changes and these will tend to be confirmed by the bond market but… how and what changes trend will tend to vary from year to year.
Equity/Bond Markets
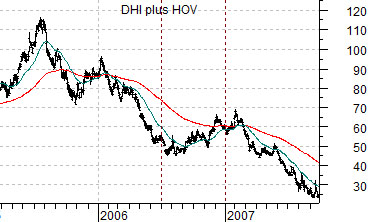
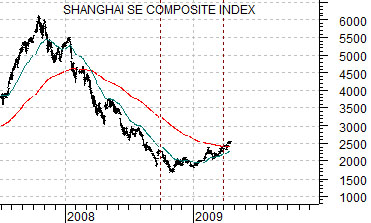
Below we show a comparison between the sum of two U.S. home builder stocks (DR Horton plus Hovnanian) from 2005 into 2007 along with the Chinese stock market (Shanghai Comp.). We are comparing the way the home builders rallied through the second half of 2006 with the strength in the Shanghai Comp. through the fourth quarter of last year and the first quarter of 2009.
The point is that the seasonal trend tends to lead to a peak in cyclical growth into May or June and the ‘driver’ behind the current recovery has been China which means that if growth is going to appear to slow or weaken from May into October it will likely be reflected through weakness in the Shanghai Comp. and copper prices. Why copper? Because there is a strong link between Asian growth, interest rates, and copper prices.
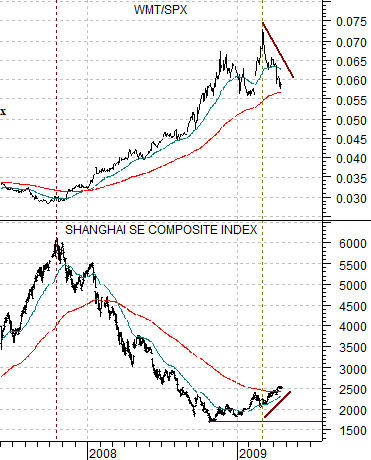
If the Shanghai Comp. were to turn lower later this quarter then we would expect to see the ratio between Wal Mart (WMT) and the S&P 500 Index (SPX) push on to new highs. Notice on the chart below that the WMT/SPX ratio turned higher back in late 2007 as the Shanghai Comp. began to weaken. This was, of course, one of the relationships that we were focusing on rather intently through the second half of 2007.
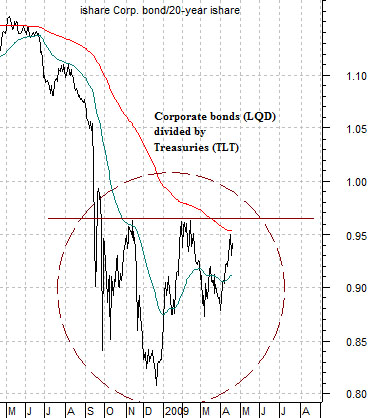
Below is chart of the ratio between the corporate bond etf (LQD) and the etf for long-term Treasuries (TLT).
When the economy is falling apart money will- quite sensibly- flow away from risk. In other words corporate bonds will decline relative to Treasury bonds. Fair enough. When the economy is recovering, however, the opposite should be true so one way to gauge the bond market’s view of ‘getter better’ versus ‘getting worse’ is through the LQD/TLT ratio. If it is rising… then it makes sense to be long equities. If, on the other hand, it is collapsing… then the equity markets will obviously be under pressure.