Feb. 11 (Bloomberg) — Gold fell from a three-week high as an advance by the dollar eroded demand for the precious metal as an alternative asset.
The greenback rose for a second straight day against a basket of major currencies as reports showed the U.S. economy is improving and Egyptian President Hosni Mubarak stepped down. Earlier, gold gained as much as 0.5 percent amid mounting tensions in Egypt.
It feels as if we have reached a general decision point with respect to precious metals prices. The offset to gold price weakness over the past few years has been pressure on the banking system but starting in the final quarter of last year the ‘laggard banks’ have begun to improve. Our sense is that if there are no more shoes left to drop following last year’s Eurozone/PIIG debacle then we should be at or perhaps past the cycle peak for gold and silver.
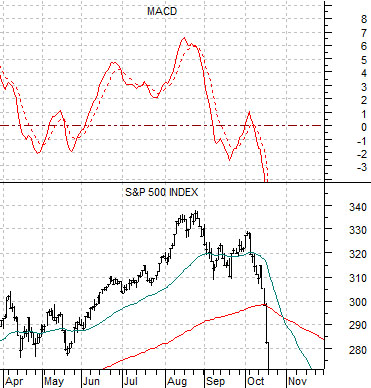
Below is a chart of the S&P 500 Index (SPX) from 1987 along with an accompanying MACD indicator. We have scaled the chart so that the October ‘crash’ is somewhat obscured so that we can focus on the interplay between the SPX and the MACD during April and May as well as during September.
The argument is that the SPX made a series of corrections within a rising trend evidenced by the declines in the MACD. In other words each time the MACD became even moderately ‘over sold’ the equity market resolved higher.
During September of 1987 the SPX corrected with the MACD falling to the same bottom as April and May. Once again the equity markets rallied into October before correcting lower until the SPX had touched what was expected to be support at 310. After a one-day bounce the index reversed back below 310 with the decline accelerating into a ‘crash’.
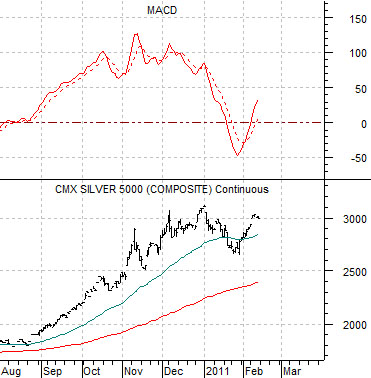
The chart below compares silver futures with the MACD indicator. Our point is that silver futures prices declined with the MACD breaking below the ‘0’ line but after the sharp rally there is a bit of a similarity between this market and the broad stock market around the start of October in 1987. With minor break downs in the Swiss franc and Japanese yen last week, a declining yield spread and downward pressure on Japanese bond prices, as well as an improvement in the price trend for the laggard banks… the intermarkets suggest that if gold and silver futures prices manage to decline back below the recent lows we could be some distance from next price support.
Equity/Bond Markets
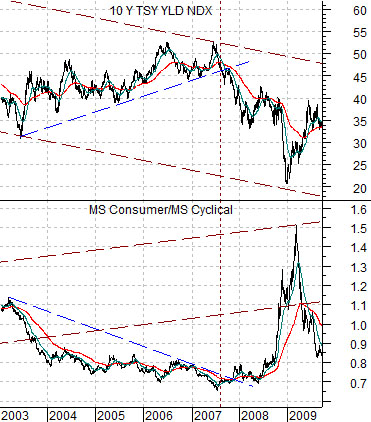
We are going to come back to a topic that we introduced last week. At right is a chart comparison between 10-year Treasury yields and the ratio between the Morgan Stanley Consumer Index and Cyclical Index from 2003 into 2009.
Over time 10-year Treasury yields have traded higher and lower within a fairly well defined channel. Back in 2007 the channel top cut through around 5.25%. After a long rally from the low point for yields in 2003 up to the channel top in 2007 the Consumer/Cyclical ratio finally reached a bottom.
The melt down during the final half of 2007 through 2008 pulled yields lower and ended with an upward spike for the consumer/cyclical ratio.
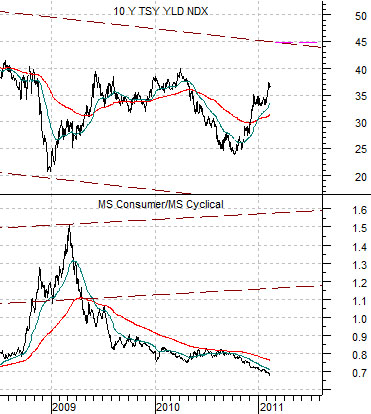
Just below we feature the same comparison from the second half of 2008 to the present day.
The argument is that as long as yields are trending higher the cyclical stocks should outperform. If 10-year yields resolve back up to the channel top during the ongoing recovery then we would expect to see significant resistance around 4.5%.
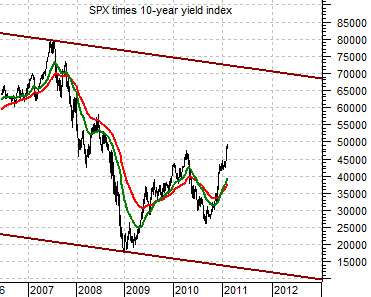
Below is a chart of the SPX times 10-year Treasury yields.
This combination has held within a nicely defined trading channel as well. If we do the ‘math’ then a return to the channel top later this year or during 2012 will lead to the product of the SPX times 10-year yields reaching roughly ‘7000’. IF yields are 4.5% then the SPX would have to be close to 1550 which, of course, represents the peak levels reached in both 2000 and 2007.
Our points are as follows. First, as long as yields are trending higher it makes sense to focus on the cyclical sectors. Second, the most upside destination for 10-year yields appears to be 4.5%. Third, a rise to 4.5% can support ongoing equity markets strength until the SPX reaches 1550.
The final point is that if long-term yields show signs of reversing lower then it makes sense to shift focus over to the large cap consumer names. For now, however, yields are still quite clearly on the rise.