We have a point to make today- hopefully- but chances are that we won’t get around to explaining exactly what it is until the third page. Between here and there we are going to focus on laying out the foundation of the argument.
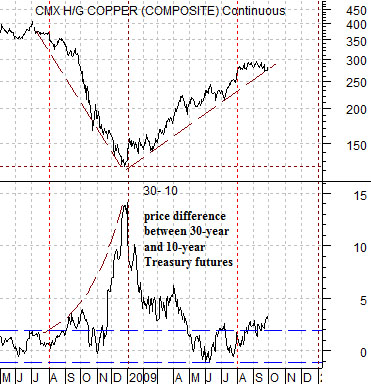
The chart below compares copper futures with the point spread or difference between 30-year and 10-year U.S. Treasury futures (30- 10).
The 30- 10 spread tends to rise or widen when bond prices push upwards in price. In other words in a rising bond market the price of the 30-year T-Bonds will move upwards at a faster pace than that of the 10-years. Conversely when interest rates are rising and bond prices are falling the spread will decline or narrow.
In general bond prices trend higher when cyclical growth begins to weaken and in most cases this is reflected by falling copper prices. The 30- 10 point spread began to push upwards in August of last year as copper prices began to decline until a peak for the point spread was reached at the end of December when copper futures prices hit a bottom.
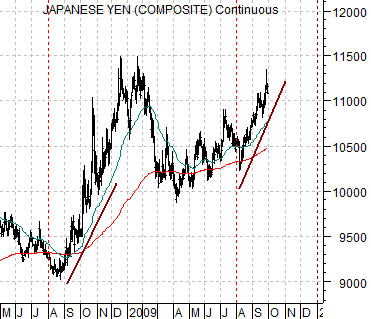
Below we show the Japanese yen futures. The chart has been set up to show the exact same time frame as the 30-10 spread versus copper futures.
An argument can be made that ‘something’ is happening within the markets and, to a certain extent, the ‘something’ is quite similar to the pre-crisis melt down that occurred during the second half of 2008.
Last year three markets began to rise as the markets lurched towards crisis: Treasuries, the Japanese yen, and the U.S. dollar. The upward pivot in the markets that trended inversely to the crisis began to gather momentum in August as the 30- 10 spread moved up from the ‘0’ line while the Japanese yen confounded the experts by pushing sequentially higher.
What is similar today is bond market and yen strength. What is different- at least so far- is the lack of U.S. dollar strength and a corresponding lack of weakness in copper and gold prices.


Equity/Bond Markets
Sept. 30 (Bloomberg) — The dollar dropped against most of its major counterparts and headed for a second straight quarterly loss against the euro as evidence the global economy is recovering boosted demand for higher-yielding assets.
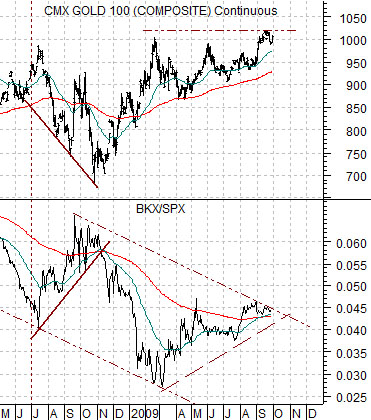
Below is a comparison between gold futures and the ratio between the Bank Index (BKX) and the S&P 500 Index (SPX).
We mentioned on page 2 that similar to last year the bond market and the yen began to rise in August while the key difference might be the lack of dollar strength.
We have argued on occasion that aside from the dollar the markets ‘offset’ to gold prices has been relative strength by the major banks. I other words when the banks weaken gold prices rise and when banks strengthen gold prices tend to feel downward pressure.
Notice on the chart below that the sharp decline in gold futures prices last year went with a period of rather intense relative strength for the banks. The BKX/SPX ratio rose fairly briskly from July through October as gold futures prices declined from close to 1000 down to around 700.
The argument would then be that there are two important intermarket relationships driving gold prices- the dollar (especially against the euro and Swiss franc) and the health or perceived health of the major U.S. banks.
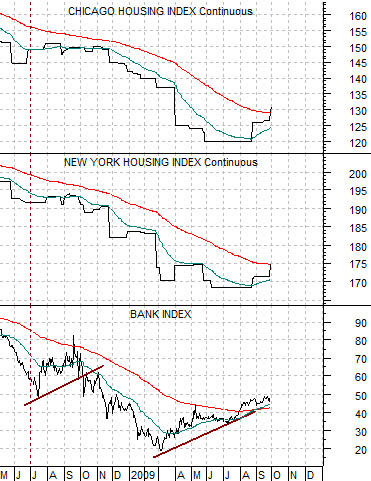
At bottom is a comparison between the Bank Index and the housing futures contracts for Chicago and New York. We could have included Miami or Washington D.C. but to keep the chart relatively uncluttered we have decided that this should suffice.
In 2008 when gold prices buckled between July and October the dollar was rising AND the Bank Index was stronger as a number of the individual city housing futures indices began to either flatten out or rise. In other words if gold trends inversely to the banks and the banks trend directly with the U.S. real estate market then we can make a case that there is a loose relationship between housing prices and gold prices.
On Tuesday the Standard and Poors/Case-Shiller home price index- an index of 20 U.S. metropolitan housing markets- rose by 1.2% from June to July although prices are still down year-over-year by more than 13%. Both the Chicago and New York housing index futures have risen back to levels last seen in February supporting the proposition that the Bank Index is not imminently set to fall of the edge once again.
We will get to the point that we are circling on the next page but the premise is that a number of the markets that began to strengthen last year as an offset to cyclical weakness seem to be pushing higher once again… which gives us cause for concern. On the other hand there are also significant differences given that the U.S. dollar remains weaker as evidenced by the lack of a downward plunge in gold prices and a steady erosion in copper prices. The Bank Index has been on the rise both on an absolute and relative basis which makes sense in light of the recent improvement in both the New York and Chicago housing index futures.


