One of the most noticeable details within the markets yesterday involved the weakness in energy prices both on an absolute basis and relative to base metals. In other words… in general… crude oil and copper tend to trend in the same direction at roughly the same time so when they start to diverge it usually means that something important is taking place.
We grant that it was only one trading day but we thought we would burn the first page explaining what ‘copper stronger than crude oil’ tends to represent.
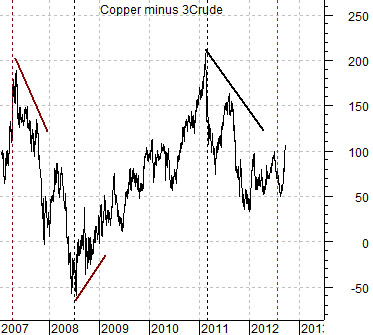
Below is a chart of the spread or difference between copper futures (in cents) and crude oil futures (in dollars times 3). One of our more eccentric views is that three times the price of crude oil in dollars should be similar to the price of copper in cents which, of course, is another way of arguing that the spread between copper and crude oil should swing back and forth through the ‘0’ line on this chart.
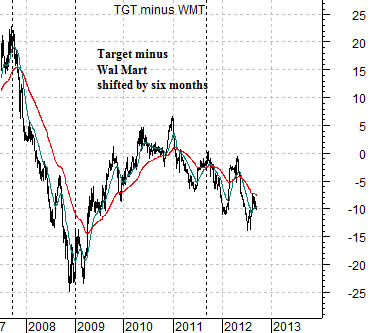
Below is a chart of the price difference between Target (TGT) and Wal Mart (WMT). Before your eyes start to glaze over this is simply a representation of ‘growth’. A market that is trending off of positive growth will favor Target which will push the spread line upwards. A market that is trending in a defensive manner will tend to prefer Wal Mart.
The two charts have been shifted or offset by six months. The argument is that the peak for the spread between copper and crude oil in the spring of 2007 led to the peak for TGT- WMT in the autumn of that year. The low point for copper compared to crude oil in the summer of 2008 preceded the low point for ‘growth’ at the end of that year.
So… when copper begins to rise relative to crude oil it means that cyclical growth is improving but, if the lag stays somewhat consistent, it may be another five or six months before the markets come to realize it. The argument here is that the collapse in crude oil prices in the second half of 2008 set the stage for 2009’s cyclical rally but only after we waded through all the detritus associated with the near-collapse of the global banking and financial system. While crude oil prices are most certainly not going to follow 2008’s path it appears likely that we will see downward pressure on yields and, perhaps, offsetting upward pressure on the energy ‘users’.
With the exception of the second half of 2008 energy price strength has put upward pressure on interest rates fairly consistently since the middle of 2003. One could argue that the most obvious dominant theme within the markets since the start of 1999 has been ‘rising energy prices’ as the commodity currencies worked upwards against the U.S. dollar.
In any event… it is almost strange to see the bond market finding price support based on energy price weakness.
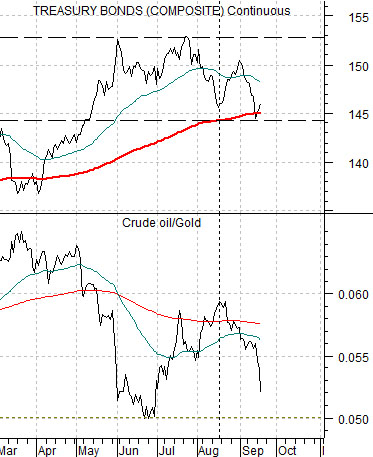
Below is a chart of the TBond futures and the ratio between crude oil and gold. A rising oil/gold ratio puts downward pressure on bond prices while a declining ratio- as has been the case since mid-August- supports bond prices.
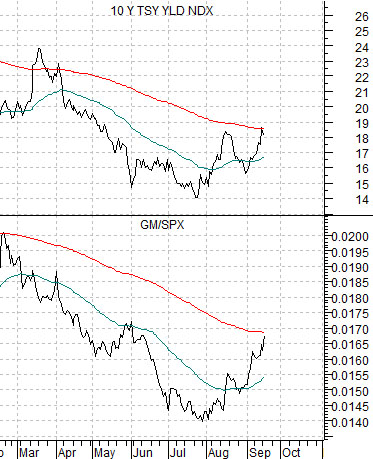
Below is a comparison between 10-year Treasury YIELDS and the ratio between General Motors (GM) and the S&P 500 Index (SPX).
Consider what the markets have been doing over the past few weeks. Energy price weakness is helping to push yields lower even as the share prices of stocks normally associated with cyclical growth (i.e. GM) strengthen. While the trend is fairly new it does seem to indicate that money is moving from energy prices over to those sectors that benefit from energy price weakness.
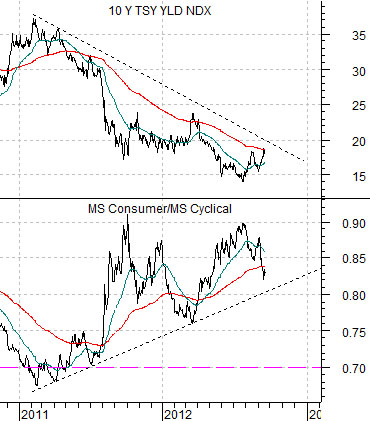
Below we compare 10-year Treasury yields with the ratio between the Morgan Stanley Consumer Index and Cyclical Index.
The consumer/cyclical index rises when yields are under pressure. One of our concerns with regard to the markets shifting back to the cyclicals on a sustained basis relates to the position of this ratio. It really should be well over 1.00 before the next cyclical bottom is reached.