Note: We will be AWOL through the first half of December. Back to work on Dec. 14th. There will be an IMRA issue sent out this evening to round out the week and then it is time to recharge the mental batteries.
Cutting to the chase we suspect that plus or minus 3% for 10-year U.S. Treasury yields may prove important in the weeks ahead. Now for the explanation…
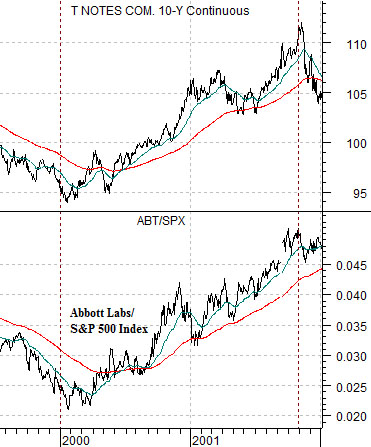
Below is a chart comparison from late 1999 through the year 2000. The arguments are that the trend for cyclical growth began to turn negative around the start of 2000 as long-term yields turned lower. As usual there was close to a 9-month lag between the initial indications of slower growth (falling yields) and the inevitable reaction by growth-oriented asset prices.
The final peak for the SPX was made around the end of August that year with the rising trend line broken in early October. The bond market ‘said’ that a problem was brewing in January with the equity and commodity markets shifting into a bearish trend at the end of the third quarter.
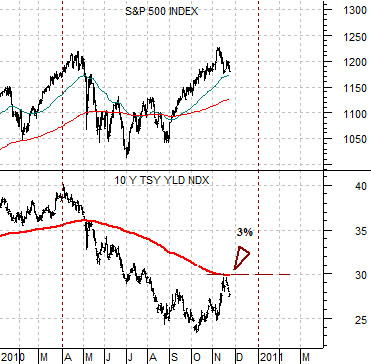
Now… notice that the yield index for 10-year U.S. Treasuries moved below the 200-day e.m.a. line in July and remained below this line for the balance of the year. With this in mind we shift to the chart at bottom right.
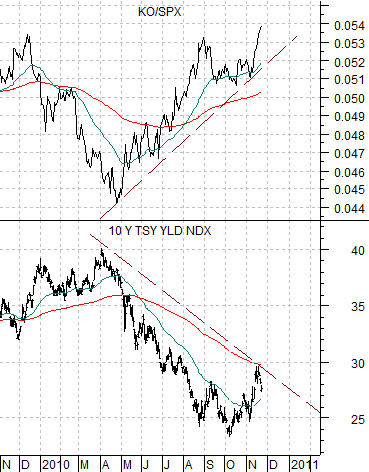
This chart compares the same two markets for the current time period. We can see that 10-year U.S. Treasury yields turned lower at the end of this year’s first quarter so if the 9-month lag were to take place once again we would expect to see growth-oriented asset prices turning lower around the end of this year. This has been, in fact, our thesis.
The problem is that an equally compelling case can be made that we aren’t at the end of cyclical strength (with falling yields) but instead are on the leading edge of a return to cyclical strength (with rising yields). In some ways the markets appear similar to 1997 and 2000 while from other perspectives it seems that conditions are actually closer to 2003.
Our thought is that if 10-year yields remain below the 200-day e.m.a. line (i.e. 3.0%) then a bearish outcome is more likely. On the other hand a rally by yields through 3.0% tips the odds in favor of a broad-based rally in the financial sector along with a peak for gold prices.
Equity/Bond Markets
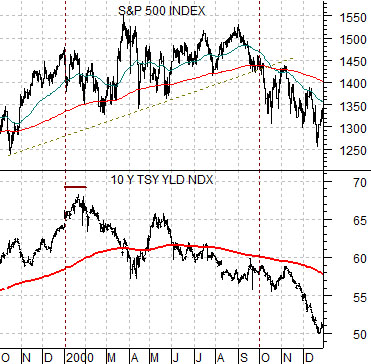
The U.S. equity market peaked in 2000 and shifted into a bearish trend that ran through most of 2002. Yet… this doesn’t tell the entire story because the decline in yields that went with slower growth helped to lift prices in a variety of sectors. Many banks, for example, were very strong during the period along with the home builders, utilities, pipelines, and medical products makers.
The chart below compares the U.S. 10-year T-Note futures with the RATIO between Abbott Labs (ABT) and the S&P 500 Index (SPX).
The point is that the ‘the trend’ actually changed in early 2000 as bond prices turned higher even though the S&P 500 Index held near the highs until the final quarter of that year. The new trend favored ABT as an offset to a stronger bond market.
Further below we show 10-year Treasury yields and the ratio between Coca Cola (KO) and the SPX. We are using yields instead of prices for this comparison but the point is that Coke began to outperform the broad market in April when yields started to decline. If 2010 is similar to 2000 then it makes sense to favor the kind of stocks that are showing relative strength in response to downward pressure on yields. For all we know the trend that began back in April may continue for the next year or two.
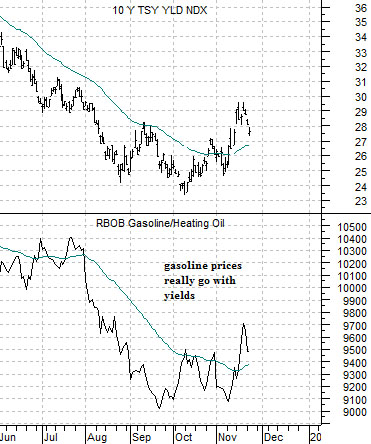
Last is a comparison between 10-year Treasury yields and the ratio between gasoline and heating oil futures.
Generally heating oil dominates the trend through the second half of the year with gasoline dominating over the first six months. One argument for temporary downward pressure on yields would be that as we shift into the new year strength in gasoline futures will push this ratio (and yields) back to the upside.